
Page 25 - TURKRptOct21
P. 25
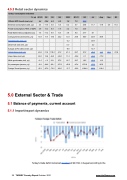
 4.5.3 Retail sector dynamics
    Turkey: Consumption indicators
 %, y/y
Q1-20
Q2
Q3
Q4
2020
Q1-21
Q2
Jul
Aug
Sep
Q3
Official GDP Growth (real, y/y)
4.4
-10.4
6.3
6.2
1.8
7.2
21.7
 Electricity Consumption (watt, y/y)
3.3
-11.5
3.6
4.5
0.2
5.7
25.8
11.7
17.9
4.5
11.5
Private Consumption (≈60% of GDP)
4.9
-9.2
8.4
7.8
3.2
7.0
22.9
Retail Sales Index (unadjusted, y/y)
7.5
-11.2
9.5
8.5
3.8
9.0
27.7
8.1
Card payments (nominal lira, y/y)
15.9
-6.4
18.5
23.2
13.0
28.8
65.4
50.8
56.6
Gasoline sales (m3, y/y)
 -3.2
30.9
Diesel fuel sales (m3, y/y)
0.3
2.2
Autogas (LPG) sales (tonne, y/y)
-8.6
15.7
Vehicle Sales (unit, y/y)
 40.6
21.6
178.0
41.2
61.3
59.7
51.2
-45.3
 -5.0
 36.9
 -31.8
Home Sales (unit, y/y)
33.0
13.8
49.2
-30.0
11.2
-22.9
2.1
-53.0
 -17.0
White goods sales (unit, y/y)
11.2
-1.2
33.1
27.2
16.7
39.7
16.2
-31.0
 -8.2
Air passengers (person, y/y)
-19.1
-94.6
-62.1
-57.9
-60.9
-47.4
678.8
175.3
 90.0
Foreign Tourist (person, y/y)
-22.1
-97.9
-73.0
-62.0
-71.7
-53.9
1,304.0
367.5
 119.4
                                                          5.0 External Sector & Trade
5.1 Balance of payments, current account
5.1.1 Import/export dynamics
     Turkey's trade deficit remained elevated at $4.31bn in August according to the
  25 TURKEY Country Report October 2021 www.intellinews.com
