
Page 14 - GEORptAug19
P. 14
changes in the judiciary they could point to, and only 16% thought that the system was developing in the right direction.
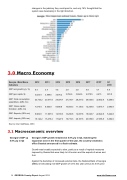
3.0 Macro Economy
Georgia - Main Macro 2012 2013 2014 2015 2016 2017 Indicators
2018* Q1 2019
GDP real growth (y/y, %)
6.4 3.4 4.6 2.9 2.8 4.8 4.7 4.9
GDP (per capita, $) 3,523.4 3,599.6 3,676.2 3,766.6 3,864.6 4,078.5 4,415 981.0
GDP: Final consumption expenditure, (GEL mn)
23,733.2 23,671.8 25,570.7 27,318.7 28,241.5 30,630.6 32,652.8 8,200.6
GDP: Gross capital formation, (GEL mn)
7,575.4 6,652.9 8,688.8 10,004.3 11,136.5 12,264.8 13,675.7 2,693.8
GDP: Exports, (GEL mn)
9,982.9 11,997.9 12,518.3 14,206.8 14,837.8 19,023.7 22,622.8 5,244.8
GDP: Imports, (GEL mn)
15,124.2 15,475.2 17,627.3 19,774.3 20,187.5 23,559.0 27,385.8 6,394.0
Source: bne IntelliNews, CEIC
3.1 Macroeconomic overview
Georgia’s GDP up 4.9% y/y in Q2
Georgia’s GDP growth remained at 4.9% y/y in Q2, matching the expansion seen in the first quarter of the year, the country’s statistics office Geostat announced in a flash estimate.
Growth was broadly expected to slow, partly as a result of reprisal measures imposed by Russia that were likely to hit tourism and the exports of wines and fruit.
Against the backdrop of increased external risks, the National Bank of Georgia (NBG) is forecasting real GDP growth of 4.5% this year (versus its 5.0% prior
14 GEORGIA Country Report August 2019 www.intellinews.com
