
Page 22 - GEORptAug19
P. 22
several years, grew by only 8-9% in 2015-16 as wage growth slowed and unemployment rose.
Retail sales y/y in Georgia averaged 16% from 2000 to 2019.
5.0 External Sector & Trade
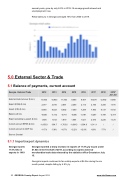
5.1 Balance of payments, current account
Georgia - External Trade 2012 2013 2014 2015 2016 2017 2018 2019* Jan-Jun
External trade turnover ($ mn)
10,433 10,933 11,463 9,505 9,407 10,679 12,492 5,968
Export (FOB) ($ mn)
2,377 2,910 2,861 2,205 2,113 2,736 3,356 1,775
Import (CIF) ($ mn)
8,056 8,023 8,602 7,300 7,294 7,943 9,137 4,193
Balance ($ mn)
-5,680 -5,112 -5,741 -5,096 -5,181 -5,207 -5,781 -2,417
Export excluding re-export ($ mn)
1,606 1,812 1,819 1,604 1,621 2,010 2,226 1,124
Current account BPM6 ($ mn)
-1,853.0 -934.7 -1,763.6 -1,684.3 -1,934.9 -1,311.1 / /
Current account to GDP (%)
-11.7% -5.8% -10.7% -12.2% -12.9% -8.8% -7.7% /
Source: Geostat
5.1.1 Import/export dynamics
Georgia reports 11.5% hike in exports in 1H19
Georgia reported a sharp increase in exports of 11.5% y/y to just under $1.8bn in the first half of 2019, according to express external merchandise trade data released by the statistics office Geostat on July 15.
Georgia’s imports continued to far outstrip exports at $4.2bn during the six month period, despite falling by 4.9% y/y.
22 GEORGIA Country Report August 2019 www.intellinews.com
