
Page 11 - GEORptMar19
P. 11
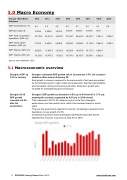
3.0   Macro Economy
Georgia - Main Macro 2012 2013 2014 2015 2016 2017 1Q18 2Q18 Indicators
GDP real growth (y/y, %)
6.4 3.4 4.6 2.9 2.7 5.0 5.3 5.6
GDP (per capita, $) 3,523.4 3,599.6 3,676.2 3,766.6 3,864.6 4,078.5 987.1 /
GDP: Final consumption expenditure, (GEL mn)
23,733.2 23,671.8 25,570.7 27,318.7 28,241.5 30,381.7 7,581.2 7,462.8
GDP: Gross capital formation, (GEL mn)
7,575.4 6,652.9 8,688.8 10,004.3 10,999.8 12,133.3 2,842.4 3,190.9
GDP: Exports, (GEL mn)
9,982.9 11,997.9 12,518.3 14,206.8 14,837.8 19,177.3 4,549.7
GDP: Imports, (GEL mn)
15,124.2 15,475.2 17,627.3 19,774.3 20,187.5 23,650.1 6,022.9
Source: bne IntelliNews, CEIC
3.1  Macroeconomic overview
Georgia’s GDP up 3.5% in January
Georgia’s 2018 GDP growth recorded at 4.8% after Q4 acceleration
Georgia’s estimated GDP growth rate in January was 3.5%, the country's statistics office said on February 28.
Real growth in January compared to the same month of last year was posted for the following sectors: trade, hotels and restaurants, financial intermediation and real estate, renting and business activities. Declines in growth were recorded for manufacturing and construction.
Georgia’s GDP growth accelerated to 4.8% y/y in Q4 from Q3’s 3.7% y/y, meaning the country’s expanded by 4.8% y/y in 2018 overall.
That compares to 2017’s 5% advance and is not far from Georgia’s performance over the medium term, which has remained robust in recent years.
This year the government expects the country, increasingly a popular tourist destination, to see growth of 4.5%.
Central bank governor Koba Gvenetadze told Reuters last week that he expected the economy to grow by at least 5% in 2019.
11  GEORGIA Country Report  March 2019    www.intellinews.com
