
Page 57 - RusRPTOct20
P. 57
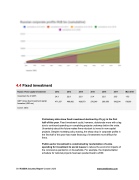
4.4 Fixed investment
Russia -Fixed capital investment 2012 2013 2014 2015 2016 2017 Mar-2018
Investment (% of GDP)
24.3 22.9 22.0 21.4 22.5 23.5 15.3
GDP: Gross fixed investment capital formation (USD mn)
471,337 496,982 428,573 276,240 280,350 342,294 58,303
source: CEIC
Preliminary data show fixed investment declined by 4% y/y in the first half of this year. Fixed investment could, however, deteriorate more with a lag due to continued spending on completing projects underway before the crisis. Uncertainty about the future makes firms reluctant to invest in new capital projects. Despite monetary policy easing, the sharp drop in corporate profits in the first half of this year has made financing of investment more difficult for firms.
Public-sector investment is constrained by reorientation of some spending for investment to social issues to relieve the economic impacts of the coronavirus pandemic on households. For example, the implementation schedule for national projects has been pushed back to 2030.
58 RUSSIA Country Report October 2020 www.intellinews.com
