
Page 66 - RusRPTSept19
P. 66
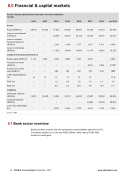
8.0 Financial & capital markets Russia -Selected performance indicators of credit institutions
(LC bn) Assets
2012
2013 2014 2015
57,423 77,653 83,000
/ 29,536 33,301 30,135 30,193
/ 1,306 1,659 2,777 3,627 / 11,330 10,684 10,804 12,174
Assets (RUB bn) 49,510
Loans to non-financial institutions /
Loans to resident
financial institutions
(RUB bn) /
Loans to individuals
(RUB bn) /
Capital and financial performance
80,063 85,192
Equity capital (RUB bn) 6,113 7,064 7,928 9,009 9,387 9,397
Provision for losses
(RUBbn) ///// 6,916
Profit for the current year (RUB bn)
CAR capital adequacy (%)
ROA (%)
ROE (%)
Liabilities
Individuals’ deposits (RUB bn)
/ / 589 192 930 790 14 13 12 13 13 12
/ / / /
14,251 16,958
1.0 0.0 1.0 8.0 2.0 10.0
18,553 23,219 24,200
1.0 8.0
25,987 24,843 2,016
Corporate deposits
(RUBbn) / / / /
Loans from CBR (RUB
bn) / / 9,287 5,363 2,726
source: CBR
8.1 Bank sector overview
Banks continue to grow and are having their most profitable year since 2016. Cumulative profits ytd in July was RUB1,005bn, which was a RUB138bn month-on-month gain.
66 RUSSIA Country Report September 2019 www.intellinews.com
2016 2017
2018
91,973 33,372
4,321 14,901
7,624 1279
1.4 12.4
28,460 25,504 2,710
Jul 2019
92,489 33,454
4,436 16,329
9,929 8,120 1005 11.8
1.9 17.1
28,982 28,983 2,592
