
Page 21 - GEORptOct20
P. 21
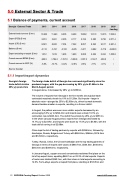
5.0 External Sector & Trade
5.1 Balance of payments, current account
Georgia - External Trade 2013 2014 2015 2016 2017 2018 2019 2020* Jan-Aug
External trade turnover ($ mn)
10,933 11,463 9,505 9,459 10,802 12,741 13,315 7,022.8
Export (FOB) ($ mn)
2,910 2,861 2,205 2,117 2,746 3,380 3,798 2,071.4
Import (CIF) ($ mn)
8,023 8,602 7,304 7,342 8,057 9,362 9,517 4,951.4
Balance ($ mn)
-5,112 -5,741 -5,100 -5,225 -5,311 -5,982 -5,719 -2,880.0
Export excluding re-export ($ mn)
1,812 1,819 1,603 1,620 2,008 2,226 2,324 1,055.8
Current account BPM6 ($ mn)
-955.5 -1,784.2 -1,767.0 -1,885.8 -1,307.5 -1,192.7 -900.5 /
Current account to GDP (%)
-5.8% -10.7% -12.2% -12.9% -8.8% -7.7% -5.1% /
Source: Geostat
5.1.1 Import/export dynamics
Georgia’s foreign trade deficit shrinks 29% y/y post-crisis
The foreign trade deficit of Georgia has narrowed significantly since the pandemic began, with the gap decreasing by 29% y/y to $1.66bn in the March-August period.
In August alone, it decreased by 28% y/y to $350mn.
The volume of exports from Georgia in the five months since global trade contracted massively shrank by 19% to $1.29bn. But imports—larger in absolute value—plunged by 25% to $2.95bn y/y, driven by weak domestic demand besides smaller re-exports, resulting in a thinner deficit.
In August, the pattern was even more visible: exports decreased by an encouraging 6.3% y/y to $292.4mn and imports saw a sharp 19.3% y/y contraction rate to $643.3mn. The deficit thus shrank by 28% y/y to $351mn. In the whole January-August period, exports from Georgia decreased by 14.7% y/y to $2.07bn, and imports were down by 17.5% y/y to $4.9bn, with the trade deficit coming in at $2.88bn.
China tops the list of trading partners by exports with $296.5mn, followed by Azerbaijan, Russia, Bulgaria and Turkey with $284.2mn, $266mn, $216.3mn and $129.6mn, respectively.
Turkey, Russia, China, the US and Azerbaijan are the top trading partners of Georgia in terms of imports with values of $840.7mn, $554.5mn, $440.9mn, $345.4mn and $309.5mn, respectively.
In January-August, copper ores and concentrates reclaimed first place on the list of top export items, equalling $462.1mn or 22.3% of total exports. Exports of motor cars totalled $260.1mn, with their share in total exports amounting to 12.6%. Ferro-alloys exports occupied third place, standing at $145.5mn and
21 GEORGIA Country Report October 2020 www.intellinews.com
