
Page 71 - RusRPTApr20
P. 71
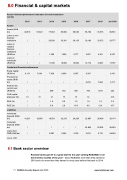
 8.0 Financial & capital markets Russia -Selected performance indicators of credit institutions
(LC bn)
Assets
Assets (RUB
bn) 49,510
Loans to non-
financial
institutions /
Loans to resident financial institutions (RUB bn)
Loans to individuals (RUB bn)
/
/
/ 29,536 33,301 30,135 30,193
/ 1,306 1,659 2,777 3,627
/ 11,330 10,684 10,804 12,174
Capital and financial performance
Equity capital (RUB bn)
Provision for losses (RUB bn)
Profit for the current year (RUB bn)
CAR capital adequacy (%)
ROA (%)
ROE (%)
Liabilities
Individuals’ deposits (RUB bn)
6,113 7,064
/ /
/ /
14 13 / / / /
14,251 16,958
7,928 9,009
/ /
589 192
12 13 1.0 0.0 8.0 2.0
18,553 23,219
9,387 9,397
2012 2013 2014
2015 2016 2017
83,000 80,063 85,192
2018
91,973
33,372
4,321
14,901
Jan 2020
96,581
33,777
5,227
17,787
2,451
57,423 77,653
Corporate
deposits (RUB
bn) / / / /
Loans from
CBR (RUB bn) / / 9,287 5,363 2,726
source: CBR
8.1 Bank sector overview
Russian banks got off to a good start to the year earning RUB393bn over the first two months of the year – about RUB45bn more than they earned in 2019 and a lot more than they earned in every year before that back to 2014.
71 RUSSIA Country Report April 2020 www.intellinews.com
/
6,916 7,624 7,417
930 790 13 12
1279 223
12.3 1.4 2.2
12.4 19.7
1.0 10.0
24,200
1.0 8.0
25,987
24,843 2,016
28,460
25,504 2,710
30,174
28,240 2449.0
