
Page 13 - BELRptFeb19
P. 13
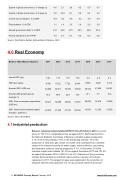
Exports of goods and services, % change y/y 4.6 2.1 2.8 4.2 5.0 6.1
Imports of goods and services, % change y/y 2.0 -10.6 -2.1 3.9 5.4 6.3
Current account balance, % of GDP -6.9 -3.3 -3.6 -3.2 -3.6 -3.5
Fiscal balance, % of GDP 1.1 1.4 1.5 1.9 2.0 2.0
General government debt, % of GDP 34.1 48.5 47.5 49.4 49.8 50.2
Poverty rate ($5.5 in 2011 PPP) 0.4 0.7 0.7 0.6 0.6 0.6
Source: World Bank, Belstat, National Bank of Belarus, CEIC
4.0  Real Economy
Belarus - Main Macro Indicators 2011 2012 2013 2014 2015 2016 2017
Annual GDP (y/y)
5.54 1.73 1.07 1.59 -3.9 -2.8 2.4
GDP (per capita) 6,306 6,722 7,722 8,040 5,949 5,023 5,732
Nominal GDP, (USD mn) 62,929 65,611 75,389 78,594 56,503 47,836 54,381
Nominal GDP growth (annual 76.5 88.6 22.9 15.8 12.1 5.7 10.6 average), %
GDP: Final consumption expenditure, 39,417 39,698 48,603 51,961 40,003 35,479 37,829 (USD mn)
GDP: Gross fixed investment capital 22,372 21,342 27,376 26,004 16,091 12,192 13,559 formation, (USD mn)
Source: CEIC, World Bank
4.1  Industrial production
Belarus' industrial output totalled BYN110.1bn ($51.2bn) in 2018  in current prices or 105.7% in comparable prices as against 2017, BelTA learned from the National Statistics Committee of Belarus. Industrial output increased by 3.1% in the mining industry, 5.8% in the processing industry, 7% in the production of electricity, gas, steam, hot water, and conditioned air. Industrial output in the industry focusing on water supply, waste collection, processing, and treatment, pollution cleanup dropped by 0.1%. In December 2018 the industrial output index totalled 101.3% as against December 2017 and 101.2% as against November 2018. In 2018 12 out of 13 branches of the processing industry demonstrated an industrial output volume in excess of the figure registered in 2017. The largest increase was registered in the production of transport vehicles and equipment (14.1% up), products made of wood and
13  BELARUS Country Report  February 2019    www.intellinews.com
