
Page 21 - RusRPTOct19
P. 21
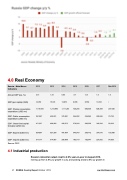
 4.0 Real Economy
           Russia - Main Macro 2012 2013 2014 2015 2016 2017 Mar-2018 Indicators
                  Annual GDP (y/y, %)
3.41 1.34 0.64 -3.7 -0.5 1.5 1.5
                  GDP (per capita) (USD)
14,079 15,531 13,873 9,055 8,759 10,743 /
                  GDP: Private consumption expenditure (USD mn)
1,116,950 1,214,990 1,111,244 720,256 680,455 826,389 207,035
                  GDP: Public consumption expenditure (USD mn)
391,097 425,831 375,081 244,282 236,063 283,696 79,723
                  GDP: Gross fixed capital formation (USD mn)
471,337 496,982 428,573 276,240 280,350 342,294 58,303
                  GDP: Exports (USD mn)
524,697 527,266 497,834 343,543 285,772 357,816 102,956
                  GDP: Imports (USD mn)
     Source: CEIC
4.1 Industrial production
317,177 314,967 286,669 182,719 182,347 227,502 54,820
                   Russia’s industrial output crept to 2.9% year-on-year in August 2019,
inching up from 2.8% y/y growth in July, and posting a total 2.6% y/y growth in
   21 RUSSIA Country Report October 2019 ww.intellinews.com
