
Page 41 - RusRPTApr19
P. 41
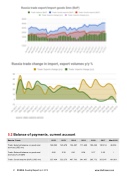
5.2 Balance of payments, current account
Russia -Trade 2012 2013 2014 2015 2016 2017 Mar-2018
Trade: External balance on goods and services (USD mn)
148,023 123,679 134,497 111,638 103,425 130,314 48,353
Trade: External balance on goods and services (% of GDP)
6.66 5.39 6.41 8.04 5.17 5.35 /
Trade: Goods exports (BoP) (USD mn)
527,434 523,275 497,763 341,467 285,772 353,547 101,881
41 RUSSIA Country Report April 2019 www.intellinews.com
