
Page 20 - GEORptJul19
P. 20
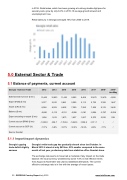
in 2016. Retail sales, which has been growing at a strong double-digit pace for several years, grew by only 8-9% in 2015-16 as wage growth slowed and unemployment rose.
Retail sales y/y in Georgia averaged 16% from 2000 to 2019.
5.0  External Sector & Trade
5.1  Balance of payments, current account
Georgia - External Trade 2012 2013 2014 2015 2016 2017 2018* 2019* Jan-May
External trade turnover ($ mn)
10,433 10,933 11,463 9,505 9,408 10,675 12,478 4,959
Export (FOB) ($ mn)
2,377 2,910 2,861 2,205 2,113 2,735 3,355 1,467
Import (CIF) ($ mn)
8,056 8,023 8,602 7,300 7,295 7,939 9,123 3,492
Balance ($ mn)
-5,680 -5,112 -5,741 -5,096 -5,181 -5,204 -5,767 -2,028
Export excluding re-export ($ mn)
1,606 1,812 1,873 1,637 1,657 2,070 2,225 939
Current account BPM6 ($ mn)
-1,853.0 -934.7 -1,763.6 -1,684.3 -1,934.9 -1,311.1 / /
Current account to GDP (%)
-11.7% -5.8% -10.7% -12.2% -12.9% -8.8% -7.7% /
Source: Geostat
5.1.1  Import/export dynamics
Georgia’s gaping trade deficit slightly narrows
Georgia’s wide trade gap has gradually shrank since last October. In March 2019 it stood at only $419mn, 25% smaller compared to the same month of last year, preliminary data from statistics office Geostat show.
The exchange rate seems to have had a moderate if any impact on the trade balance: the local currency weakened by some 7.8% in real effective terms from August to November last year but stabilised afterwards. The current effective exchange rate is in line with the average of recent years.
20  GEORGIA Country Report  July 2019    www.intellinews.com
