
Page 2 - bne_newspaper_March_22_2019
P. 2
Top Stories
March 22, 2019 www.intellinews.com I Page 2
US Fed easing sends a “wall of money” to emerging markets
The stock volumes tracker, EPFR Global, released fund flows data through the week ending March 13 and found that Russia saw net outflows of circa $140mn from combined equity and bond fund flows in the reported week, compared to circa $30mn of outflows in the previous week.
EM sell off
That wall of money is expected to lift EMs in the longer term, but after strong inflows into emerging markets since the start of this year, the tide turned in the last week when there was a general sell off as investors remain caught between medium-term and short-term drivers.
“After a brief rally in January, emerging market currencies have been on the back foot, a
surprise given the dovish shift from the Fed and abating China-US trade tensions. We hear many explanations, ranging from tail risks like Brexit
to investor caution after the EM sell-off in 2018. These things may play a role, but we see foreign investor positioning as the principal driver. After all, the backdrop to EM these days is a decade of ultra-easy G-3 monetary policy, which drove a wall of money to EM. Those flows have in some cases built up to large positioning overhangs, so that the same dovish shift from the Fed isn’t the positive impulse it once was,” the Institute of International Finance (IIF) said in a note.
Things are changing. Many of the emerging markets have already all but emerged and so are less sensitive to the swings in international capital flows. And fundamentals seem to count for less as politics is taking a bigger role. US President Donald Trump’s trade war with China and Russia’s sanctions war with the west have become more important than a blistering pace of economic growth or financial fortresses. But in Russia’s
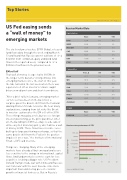
Russian Market Data Value
1M YTD
Equity Indices
RTSI
1,238
4%
16%
MOEX
2,508
2%
6%
MSCI EM
1,070
2%
11%
S&P
2,855
3%
15%
NASDAQ
7,839
5%
19%
DAX
11,550
1%
9%
FTSE
7,355
3%
9%
Commodities
Price, $
1M YTD
Brent
67.7
1%
25%
WTI
59.8
5%
32%
Urals
74.2
-4%
65%
Gold
1,309
-1%
2%
Silver
15.5
-2%
0%
Nickel
13,135
3%
24%
Copper
6,520
2%
9%
Aluminum
1,892
2%
1%
FOREX
Value
Russia sectors performance % YTD
1M YTD
EUR/RUB
72.67
-2%
-8%
Russia sectors performance % YTD
Oil & Gas Utilities Financials Consumers Telecoms M&M RTS MOEX
11
16
19 20
15.8
11
10
5.8
0 5 10 15 20 25
Source: MOEX, BCS GM
source: MOEX, BCS GM
Sectors: % return YTD
