
Page 28 - RUSRptSept18
P. 28
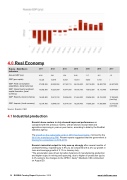
4.0  Real Economy
Russia - Main Macro Indicators
2011 2012 2013 2014 2015 2016 2017
Annual GDP (y/y)
4.26 3.41 1.34 0.64 -3.7 -0.5 1.5
GDP (per capita)
13,324 14,079 15,531 13,873 9,055 8,731 /
GDP: Final consumption expenditure, (local currency)
37,208,226 42,205,094 47,163,119 56,336,400 59,116,800 59,822,700 64,637,500
GDP: Gross fixed investment capital formation, (local currency)
13,982,500 15,223,900 15,077,000 16,436,100 16,812,800 18,112,400 19,944,000
GDP: Exports, (local currency)
16,940,900 18,413,100 18,936,600 21,464,200 23,606,500 22,124,300 17,083,600 (Jan-Sep)
GDP: Imports, (local currency)
12,164,400 13,848,100 15,014,100 16,296,400 17,095,200 17,685,800 13,716,100 (Jan-Sep)
Source: Rosstat, CEIC
4.1  Industrial production
Russia's base sectors in July showed improved performance  as compared with the previous months, with all sectors except retail and agriculture improving in year-on-year terms, according to data by the RosStat statistics agency.
The  growth on the output side so far in 2018 has been feeble , mirrored by the fall in the manufacturing PMI . Recent reports suggested that the government is bracing for a slowdown in 2018-2019 .
Russia’s industrial output for July was up strongly  after several months of underperforming, expanding by 3.9% y/y as compared with 2.2% y/y growth in June and average growth of 3.1% in January-July.
"The acceleration was driven by better dynamics of manufacturing production and higher output in mining and quarrying, due to higher oil production (up by 2.4% owing to the changes to the OPEC+ deal)," Sberbank CIB commented on August 20.
28  RUSSIA Country Report  September 2018    www.intellinews.com
