
Page 34 - RUSRptSept18
P. 34
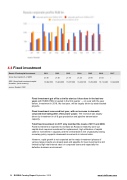
4.4  Fixed investment
Russia -Fixed capital investment 2011 2012 2013 2014 2015 2016 2017
Gross fixed capital (% of GDP)
21.49 21.55 21.78 21.25 20.75 21.05 /
GDP: Gross fixed investment capital formation, (local currency)
13,982,500 15,223,900 15,077,000 16,436,100 16,812,800 18,112,400 19,944,000
source: Rosstat, CEIC
Fixed investment got off to a similar start as it has done in the last two years  with RUB3,079bn invested in the first quarter -- on a par with the year before. Investment in 2018, like last year, will be largely driven by state-backed projects.
Fixed investment recovered last year, with an increase in domestic corporate borrowing after a few years’ pause.  The increase was largely driven by investment in oil & gas production and pipeline transmission capacity.
Total fixed investment in 2017 only matched the levels of 2011 and 2008.
Fixed investment is expected to increase as Russia’s relatively worn-out capital stock requires investment for replacement, high utilisation of capital calls for investment in capacity and the central bank’s line of gradually easing monetary policy supports downward movements in interest rates.
However, rapid growth is not expected as the major investment phases of various large projects are already past and appetite for new investment is still limited by high real interest rates on corporate loans and especially the defective business environment.
34  RUSSIA Country Report  September 2018    www.intellinews.com
