
Page 52 - RusRPTDec20
P. 52
5.2 Balance of payments, current account
Russia trade dynamics $bn
Oct 2019
Nov 2019
Dec 2019
Jan 2020
Feb 2020
Mar 2020
Apr 2020
May 2020
Jun 2020
Jul 2020
Aug 2020
Sep 2020
Oct 2020
foreign trade t/o
55.9
59.8
58.6
56.1
46.6
46.6
49.9
40.7
38.1
43.1
43.1
42.8
51.0
export of goods
35.0
36.1
35.4
34.9
29.5
28.1
29.6
23.5
20.9
24.2
23.7
23.3
30.5
import of goods
-20.9
-23.7
-23.2
-21.2
-17.0
-18.5
-20.3
-17.2
-17.2
-18.9
-19.4
-19.5
-20.5
good trade balance
14.1
12.4
12.2
13.7
12.5
9.6
9.3
6.3
3.7
5.3
4.3
3.8
10.0
source: GKS
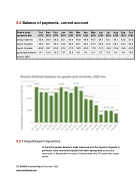
5.2.1 Import/export dynamics
52 RUSSIA Country Report December 2020 www.intellinews.com
In the third quarter Russia’s trade improved and the imports of goods in particular have recovered rapidly from their spring lows as demand recovered. In September the value of imports was only 3% lower than a year earlier.
