
Page 58 - RusRPTJul20
P. 58
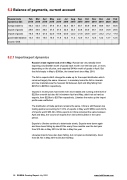
5.2 Balance of payments, current account
Russia trade dynamics $bn
Feb 2019
Mar 2019
Apr 2019
May 2019
Jun 2019
Jul 2019
Aug 2019
Sep 2019
Oct 2019
Nov 2019
Dec 2019
Jan 2020
Feb 2020
foreign trade t/o
46.3
52.4
57.5
57.6
51.4
52.4
55.7
55.7
55.9
59.8
58.6
56.1
46.6
export of goods
29.8
34.0
36.5
37.5
31.6
32.5
33.4
33.8
35.0
36.1
35.4
34.9
29.5
import of goods
-16.5
-18.4
-21.0
-22.0
-19.8
-20.0
-22.2
-21.8
-20.9
-23.7
-23.2
-21.2
-17.0
good trade balance
13.3
15.6
15.5
15.5
11.8
12.5
11.2
12.0
14.1
12.4
12.2
13.7
12.5
source: GKS
5.2.1 Import/export dynamics
Russia’s trade regime took a hit in May. Russia has very steadily been exporting circa $420bn worth of goods each month over the last year, or more, depending on the oil price, and exported $414bn worth of goods in April. But that fell sharply in May to $366bn, the lowest level since May 2018.
The fall in exports didn't change the make up for the export distribution which remained largely the same. However, in monetary terms the fall in minerals and raw materials saw the heaviest fall between April and May falling from $237bn to $205bn respectively.
Imports in recent years have been even more stable and running at the level of $225bn a month but also fell in between April and May, albeit not as hard as exports, from $229bn to $207bn respectively. Likewise the make up the import profile was unaffected.
The distribution of trade partners remains the same. China is still Russia’s top trading partner accounting for 13.6% of exports in May worth $53bn and 22.4% of imports worth $53.3bn. While exports to China remained the same between April and May, the volume of imports from China fell by $4bn in the same period.
Exports to Ukraine continue to deteriorate slowly. Exports were down again and have been falling by about $1bn every three months over the last year from $10.4bn in May 2019 to $5.3bn in May this year.
Likewise imports have also been falling, but not quiet as dramatically, down from $5.7bn in May 2019 to $4.3bn this May.
58 RUSSIA Country Report July 2020 www.intellinews.com
