
Page 20 - GEORptSep19
P. 20
several years, grew by only 8-9% in 2015-16 as wage growth slowed and unemployment rose.
Retail sales y/y in Georgia averaged 16% from 2000 to 2019.
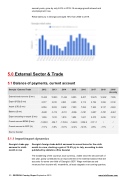
5.0 External Sector & Trade
5.1 Balance of payments, current account
Georgia - External Trade 2012 2013 2014 2015 2016 2017 2018 2019* Jan-July
External trade turnover ($ mn)
10,433 10,933 11,463 9,505 9,407 10,679 12,492 7,065
Export (FOB) ($ mn)
2,377 2,910 2,861 2,205 2,113 2,736 3,356 2,102
Import (CIF) ($ mn)
8,056 8,023 8,602 7,300 7,294 7,943 9,137 4,963
Balance ($ mn)
-5,680 -5,112 -5,741 -5,096 -5,181 -5,207 -5,781 -2,861
Export excluding re-export ($ mn)
1,606 1,812 1,819 1,604 1,621 2,010 2,226 1,312
Current account BPM6 ($ mn)
-1,853.0 -934.7 -1,763.6 -1,684.3 -1,934.9 -1,311.1 / /
Current account to GDP (%)
-11.7% -5.8% -10.7% -12.2% -12.9% -8.8% -7.7% /
Source: Geostat
5.1.1 Import/export dynamics
Georgia’s trade gap narrows for ninth month in row
Georgia’s foreign trade deficit narrowed in annual terms for the ninth month in a row, clocking a gain of 15.9% y/y in July, according to data published by statistics office Geostat.
The weakening of the country’s local currency, visible since the second half of last year, partly contributed to an improvement in the external balance that still accounts for some one-third of Georgia’s GDP. Wage remittances and revenues from tourism will, meanwhile, at least stagnate over coming quarters,
20 GEORGIA Country Report September 2019 www.intellinews.com
