
Page 33 - bne_December 2017_20171204
P. 33
bne December 2017 Central Europe I 33
ing, but the low levels of productivity and poor infrastructure mean investors are not ready to make the switch as yet.
In Poland, where growth is seen ris-
ing to 4.1% this year, the pace will
slow to 3.4% as the one-off impact
of increased social payments fades.
The near-term economic outlook has improved in Hungary on the back of cuts in the rates of corporate income tax and social security contributions as well as increased minimum wages. And labour shortages and the rising cost of labour in Czechia and Slovakia will also undermine growth in these countries in the medium term. All these nations are reaching a tipping point where
they will have to reinvest themselves, ditching the low-cost, export-orientated models they have followed so far.
Southeastern Europe
In southeastern Europe, average growth is also expected to accelerate, reaching 3.6% in 2017 before mod- erating to 3.3% in 2018. The Greek economy has returned to growth in the first half of the year amid progress in reforms and rising confidence.
Growth in Eastern Europe and the Cau- casus as a whole is expected to pick up from near-zero to close to 1.5% in 2017 as headwinds from low commodity prices and the earlier recession in Russia subside, although Azerbaijan’s economy is project- ed to remain in recession. A gradual recov- ery in the region is set to continue in 2018.
Growth in Turkey is projected to acceler- ate to 5.1% in 2017 on the back of gov- ernment stimuli before slowing to 3.5% in 2018 as the fiscal impact wears off.
Economies in the southern and east- ern Mediterranean (SEMED) region
are expected to show growth of 3.8%
in 2017 and 4% in 2018, supported by reform implementation and a continued recovery in the tourism sector, as well as export rebounds in Egypt and Jordan.
Morocco is the only country in the SEMED region that is expected to see a slowdown in growth during 2018, as the base effect from the agricultural rebound in 2017 (after a very poor 2016) is removed.
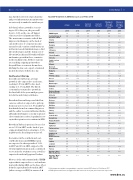
Real GDP Growth (In %; EBRD forecasts as of 7 Nov 2017)
Actual
Actual
Current forecast
Current forecast
Change in forecast since May 2017
Change in forecast since May 2017
2015
2016
2017
2018
2017
2018
EBRD Region
Croatia
Hungary
Lithuania
Slovak Republic
South-eastern Europe
Greece -0.3 -0.2
1.3 1.9
2.3 3 3.4 2.2 2 2.3 3.9 3.3 2.4 2.9
3.1 3.2 Cyprus 2 3
3.3 3
2.9 2.6 3.8 3.4 3.6 3.5 3.3 3.5 3.6 3.3
2.5 3
3.5 2.5 2 2.2 3.7 3.3 1.8 2.9
3.5 3.5 1.5 2
3 3.5 5.1 3.5 4.5 4.4 4.4 4.2 6.5 5 5.4 6.2
4.1 4.5 2.3 2.5 2.2 2.7
4.2 3.6
0.9 0.2
0 0 0.8 0.4 0.7 0.5 0.1 0 0.5 0.3
0 0
1 0.3
0 0 0.7 0 -1.1 -0.1
1 0.5 21 00 2.5 0.5 0.7 -0.1 0.5 0.1
2.7 1 -0.8 -0.3
0.3 0
00 1.1 0.2
Central Europe & the Baltic states
3.5
2.8
3.9
3.4
0.8
0.3
Estonia
1.7
2.1
3.7
3.4
1.3
0.7
Latvia
2.8
2.1
4.7
4.1
1.6
0.9
Poland
3.8
2.9
4.1
3.4
0.9
0.2
Slovenia
2.3
3.1
4
2.9
1.5
0.7
Albania
2.2
3.4
3.7
3.7
0.2
0
Bosnia & Herzegovina
Bulgaria
3.6
3.9
3.5
3.2
0.3
0.2
FYR Macedonia
3.8
2.4
1.5
2.5
-0.9
-0.5
Kosovo
4
3.4
3.7
3.5
0.2
0
Montenegro 3.4 Serbia 0.8
Armenia 3.2
2.9 2.8
0.2 -3.8 -2.6 -0.4 4.3
6.1 3.2 3.7 3.6 3.9 3.8
6 6.9 8 7.8
4.4 4.3 0.8 1 1.1 1
4.2 3.1
Romania
4
4.6
5.3
4.2
1.3
0.7
Eastern Europe & the Caucasus
-4.8
0.1
1.6
2.7
0.5
0.2
Azerbaijan
1.1
-3.1
-0.5
2
0
0
Belarus Moldova
Turkey
Central Asia Kyrgyz Republic Tajikistan Uzbekistan
Egypt Lebanon Tunisia
Average "West": CEB, SEE, SE- MED, Turkey
Georgia
2.9
2.7
4.5
4.5
0.6
0.3
Ukraine
-9.8
2.3
2
3
0
0
Russia
-2.8
-0.2
1.8
1.7
0.6
0.3
Kazakhstan
1.2
1.1
3.8
3.5
1.4
0
Mongolia
2.4
1
2.6
3
1.2
0.2
Turkmenistan
6.5
6.2
5.7
5.1
0
-0.9
Southern & Eastern Mediterranean
3.9
3.3
3.8
4
0.1
-0.1
Jordan
2.4
2
2.3
2.5
0
0
Morocco
4.6
1.2
4.2
3.5
0
-0.3
Average "East": EEC, CA, Russia
-2.1
0.4
2.2
2.3
0.6
0.2
1 All averages use weights corresponding to countries' nominal GDP values in US dollars at PPP.
2 EBRD figures and forecast for Egypt's real GDP reflect the fiscal year, which runs from July to June.
www.bne.eu
