
Page 13 - GEORptOct19
P. 13
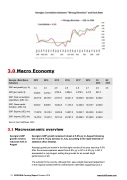
3.0 Macro Economy
Georgia - Main Macro 2013 2014 2015 2016 Indicators
2017 2018
Q1 Q2 2019 2019
GDP real growth (y/y, %)
3.4 4.6 2.9 2.8 4.8 4.7 4.9 4.5
GDP (per capita, $) 3,599.6 3,676.2 3,766.6 3,864.6 4,078.5 4,415 981.0
GDP: Final consumption expenditure, (GEL mn)
23,671.8 25,570.7 27,318.7 28,241.5 30,630.6 32,652.8 8,200.6
GDP: Gross capital formation, (GEL mn)
6,652.9 8,688.8 10,004.3 11,136.5 12,264.8 13,675.7 2,693.8
GDP: Exports, (GEL mn)
11,997.9 12,518.3 14,206.8 14,837.8 19,023.7 22,622.8 5,244.8
GDP: Imports, (GEL mn)
15,475.2 17,627.3 19,774.3 20,187.5 23,559.0 27,385.8 6,394.0
Source: bne IntelliNews, CEIC
3.1 Macroeconomic overview
Georgia’s GDP growth remains robust at 5.8% in August
Georgia’s GDP growth remained robust at 5.8% y/y in August following the record 6.1% y/y advance in July, according to the rapid estimate of statistics office Geostat.
Average growth per month in the first eight months of the year was thus 5.0%. After the annual expansion eased from 4.9% y/y in Q1 to 4.5% y/y in Q2, it accelerated in July-August, setting the grounds for an overall bright performance in Q3.
The outlook for the country, although firm, saw a slight downward adjustment in the regional context with the central bank’s rate hikes supporting such a
13 GEORGIA Country Report October 2019 www.intellinews.com
