
Page 30 - TURKRptJun19
P. 30
30
TURKEY Country Report June 2019
www.intellinews.com
48 5.31 52 4.97 31 3.71
22 6.35 44 2.43
18 2.92 24 1.35 34 1.97 49 4.97
6,638 5,690 6,769
5,537 3,830
1,683 1,330 2,326 3,713
5% 1,722 -14% -6% 1,413 -17% 9% 1,458 -19%
13% 779 -32%
10% 1,057 -1%
13% 478 11% 4% 325 0% 90% 448 14%
7.42 1.18 4.54 3.85 0.5 4.46
10.2 5.05 6.89 6.16 2.62 4.22 5.01 0.91 4.76
0.41 24 3.4% 9.1% 17%
2.3 25 22.3% 52.1% -23%
0.59 3 4.9% 8.7% -84% 0.61 3 7.3% 14.6% -26% 1.03 5 14.5% 22.0% 29% 0.42 11 3.1% 8.8% 31%
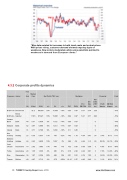
“May data pointed to increases in both input costs and output prices. With prices rising, customer demand showed ongoing signs of weakness. New orders moderated, while some panellists pointed to weakness in demand from European clients.”
4.3.2 Corporate profits dynamics
Company
BIST-100
BIST-ALL
Garanti Bank
Akbank
Isbank
Koc Holding
Sabanci Holding
Ford Otosan
Tofas Sise Tupras
Sector
Benchmark
Borsa Istanbul
Bank Bank Bank
Holding
Holding
Automotive Automotive Glassmaker Refiner
Free
- Market
float Cap
(%) ($ bn)
92.2 88,880
118.5 97,821
Net Profit (TRY mn)
Multiples
Net EV/ Debt EV / SAL (TRY
P/E P/BV EBITDA ES bn) 6.93 0.87 5.01 0.74 228
8.02 0.97 5.21 0.71 293
5.05 0.67 0 5.57 0.63 0 3.5 0.45 0
Financial
Profit Margin
Yield
EBITDA Margin y/y
-15% -15%
-14% -20% -18%
2018
y/y 20%
18%
Q1 y/y 15,655 -10%
15,691 -18%
-3% -375 -150% 10.15 2.57 4.85
