
Page 36 - RusRPTNov18
P. 36
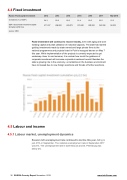
4.4   Fixed investment
Russia -Fixed capital investment 2012 2013 2014 2015 2016 2017 Mar-2018
Investment (% of GDP)
24.3 22.9 22.0 21.4 22.5 23.5 15.3
GDP: Gross fixed investment capital formation (USD mn)
471,337 496,982 428,573 276,240 280,350 342,294 58,303
source: CEIC
Fixed investment will continue to recover slowly,   even with aging and worn existing capital and peak utilisation of industrial capacity. The state has started guiding investments made by state-owned and large private firms to the national programmes and projects listed in Putin’s inaugural decree on May 7 this year. While implementation of the projects is currently expected to get underway closer to next summer, it is unclear how much the guidance of corporate investment will increase corporate investment overall. Besides the state’s growing role in the economy, uncertainties in the business environment have increased due to new foreign sanctions and threats of further sanctions.
4.5   Labour and income
4.5.1   Labour market, unemployment dynamics
Russia’s ILO unemployment rate continued to decline this year,   falling to just 4.5% in September. The national unemployment rate in September 2017 was 5%. The unemployment rate in both Moscow and St. Petersburg was below 2%.
36  RUSSIA Country Report   November 2018    www.intellinews.com
