
Page 40 - bne IntelliNews Ukraine Country Report May 2017
P. 40
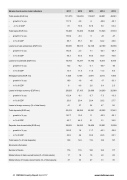
Ukraine bank sector main indicators 2011 2012 2013 2014 2015
Total assets (EUR mn) 101,373 106,239 112,607 68,801 48,061
- growth in % yoy 177.3 4.8 6 -38.9 -30.1
- - in % of GDP 81 79.9 87.8 83 63.4
Total loans (EUR mn) 73,488 73,260 76,929 51,543 37,610
- growth in % yoy 169.2 -0.3 5 -33 -27
- in % of GDP 58.7 55.1 60 62.2 49.6
Loans to private enterprises (EUR mn) 56,695 58,013 62,148 42,189 30,936
- growth in % yoy 182.5 2.3 7.1 -32.1 -26.7
- in % of GDP 45.3 43.6 48.5 50.9 40.8
Loans to households (EUR mn) 16,793 15,247 14,782 9,354 6,545
- growth in % yoy 132 -9.2 -3.1 -36.7 -30
- in % of GDP 13.4 11.5 11.5 11.3 8.6
Mortgage loans (EUR mn) 7,526 6,168 3,394 2,816 1,883
- growth in % yoy 109 -18 -45 -17 -33.1
- in % of GDP 6 4.6 2.6 3.4 2.5
Loans in foreign currency (EUR mn) 29,829 27,103 26,098 24,200 20,989
- growth in % yoy 132.4 -9.1 -3.7 -7.3 -13.3
- in % of GDP 23.8 20.4 20.4 29.2 27.7
Loans in foreign currency (% of total loans) 41 37 34 47 56
Total deposits (EUR mn) 53,419 58,926 65,391 42,302 27,461
- growth in % yoy 187.7 10.3 11 -35.3 -35.1
- in % of GDP 42.7 44.3 51 51 36.2
Deposits from households (EUR mn) 29,822 34,593 38,656 22,001 15,258
- growth in % yoy 180.3 16 11.7 -43.1 -30.6
- in % of GDP 23.8 26 30.2 26.5 20.1
Total loans (% of total deposits) 138 124 118 122 137
Structural information
Number of banks 176 176 180 163 117
Market share of state-owned banks (% of total assets) 17 18 18 22 28
Market share of foreign-owned banks (% of total assets) 37 33 27 31 35
40  RUSSIA Country Report  April 2017    www.intellinews.com
