
Page 53 - BNE_magazine_11_2019
P. 53
bne November 2019
Opinion 53
90 90 80 80 70 70 60 60 50 50 40 40
30 30
20 10
Control of Corruption
Regulatory Quality 20 Rule of Law
Voice and Accountability 10
Control of Corruption
Regulatory Quality
Rule of Law
Voice and Accountability
2010 2011 2012 2013 2014 2015 2016 2017
00 2010 2011 2012 2013 2014 2015 2016 2017
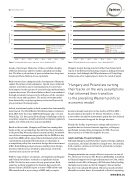
Figure 1.1 Hungary World Governance Indicators. Source: World Bank (2017)
decade, if not longer. Memories of these erstwhile disciples of liberal democracy and free market capitalism are fading fast. The blue-eyed students of post-socialism have long since become problem children of neo-capitalism.
Both countries have championed the development of domestic capital, favouring certain companies. Special taxes, unilateral contract conversions and re-nationalisation of sectors have been imposed at the expense of certain foreign multinationals in particular sectors. Checks and balances have been weakened through systematic increases in the influence of the executive over the courts and regulators. The media environment has been distorted by creeping regulatory action and buyouts by pro-government businesspeople.
Indeed, institutional quality in both countries has demonstrably deteriorated. The World Bank’s World Governance Indicators from 2017 show that since 2010 both Hungary (fig. 1.1) and Poland (fig. 1.2) have generally declining or flatlining results in several key categories, notably control of corruption, regulatory quality, rule of law and voice and accountability.
Based on these trends, Hungary and Poland are turning their backs on the very assumptions that informed their transition to the prevailing Western political economic model. A textbook case of these assumptions was provided by the OECD in a key study from 2000, which argued that institutional reform, fiscal consolidation and market liberalisation are the pillars of
a competition policy that can attract foreign direct investment (FDI). Establishing good governance would provide foreign investors with the peace of mind to plan ahead, even if the electoral cycle ejected a curveball.
With the logic of these conclusions, developments in Hungary and Poland should have resulted in a significant decline
in FDI. Yet this has not occurred to any great extent. Both countries perform strongly in the Central, East and South Eastern Europe (CESEE) region in terms of FDI inflows and FDI inward stock as a percentage of GDP and per capita.
Figure 1.2 Poland World Governance Indicators. Source: World Bank (2017)
Hungary, despite having gone far further than Poland with respect to its illiberal restructuring, remains a darling of foreign investors. And although the FDI performance of Poland lags behind some of its regional peers, this is the result of policy
“Hungary and Poland are turning their backs on the very assumptions that informed their transition
to the prevailing Western political economic model”
decisions already made prior to the election of PiS in 2015 –
by governments deemed to be ‘liberal’. Elsewhere, Serbia –
a state whose already low institutional quality has also declined – has even increased in appeal for foreign investors.
Clearly, the decline in governance ratings and increase in populism has not lessened investor appetites, as Hungary and Poland remain prime destinations for FDI. There are three reasons as to why this might be the case.
Jekyll and Hyde: The policy flipside
Although Hungary and Poland have targeted foreign capital in recent years, the initial discomfort is largely over. Structurally, both countries continue to roll out the proverbial red carpet for foreign investors.
Hungary maintains an average effective corporate tax rate of 5%, the lowest level in the EU. Between 2010-2018, it doubled its financial support for foreign multinationals to €1bn, which similarly receive 66% of Hungary’s EU Cohesion Policy funding, the highest proportion in the EU. Hungary’s labour market has also been radically liberalised. Fidesz has nearly doubled allowable overtime hours, decentralised collective bargaining,
www.bne.eu
Percentile Rank
Percentile Rank
