
Page 52 - RusRPTJun19
P. 52
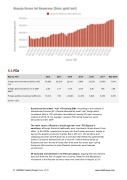
5.3 FDI
Russia -FDI 2012 2013 2014 2015 2016 2017 Mar-2018
Foreign direct investment (BoP) (USD mn)
50,588 69,219 22,031 6,854 32,539 27,886 7,044
Foreign direct investment: % of GDP (BoP)
2.29 3.11 1.05 2.09 2.28 1.85 1.80
Foreign portfolio investment (USD mn)
19,312 748 -23,203 -12,872 3,020 9,330 3,728
source: CEIC
Russia has the lowest “real” FDI among EMs. According to the Institute of International Finance (IIF), Russia attracted the least “real” foreign direct investment (that is, FDI excluding reinvestment) among 23 major emerging markets in 2015-18. On average,” genuine” FDI during those four years amounted to 0.2% GDP.
The main cause of Russia’s shockingly low “real” FDI figures is sanctions, although Russia’s traditionally poor investment climate doesn’t help either. In the 2000s, investors put money into the Russian economy, hoping to tap into the growing consumer market. But in 2014-15, US sanctions and collapsing oil prices sent Russia into a recession that effectively quashed that market. Consumer demand has yet to recover—which makes sense as Russians are even worse off today than they were four years ago—giving foreigners little incentive to enter Russia’s notoriously poor business environment.
IIF excluded reinvestment in its FDI calculations, arguing that reinvestment does not show the flow of capital into a country. Based on this adjustment, investment in the Russian economy was even lower than in Nigeria (0.3%
52 RUSSIA Country Report June 2019 www.intellinews.com
