
Page 64 - RusRPTJun19
P. 64
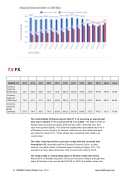
7.0 FX
RUSSIA -FX
Currency (units per EUR) (eop)
Currency (units per USD) (eop)
Currency (units per EUR) (average)
2015
79.7
72.9
67.8
2016
64.8
61.5
74.4
2017
68.9
57.6
65.8
2018
79.5
69.5
74.0
2Q17
67.5
59.09
62.88
3Q17
68.04
58.02
69.22
4Q17
69.26
57.73
68.78
1Q18
70.36
57.09
69.88
2Q18
73.39
62.73
73.73
3Q18
81.00
69.99
76.02
4Q18
79.46
69.47
76.11
1Q19
72.89
64.80
75.08
The Central Bank of Russia reports that 67 % of invoicing on exports last year was in dollars, 17 % in euros and 14 % in rubles. The dollar’s share of foreign trade invoicing has slowly declined since 2013, while the euro and ruble have gained slightly. The dollar has traditionally represented about 40 % of Russia’s invoice currency for imports, while the euro and ruble have each accounted for about 30 %. These shares have remained quite stable over recent years.
The ruble is the top invoice currency in trade with the countries that formed the CIS, especially with the Eurasian Economic Union. In other markets, the ruble’s share in Russian export invoicing is below 10 %. The exception is India, where that share rose to more than a third in 2018.
The dollar holds a commanding status in Russia’s trade with China.
Almost 90 % of Russian exports to China are invoiced in dollars, although that share fell sharply in the second half of 2018. In 4Q18, the dollar’s share was
64 RUSSIA Country Report June 2019 www.intellinews.com
