
Page 22 - TURKRptSep21
P. 22
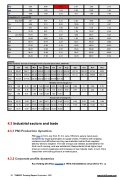
          May
3.94
0.89
 4.43
2.51
3.08
2.73
Jun
 3.28
1.94
1.69
2.63
8.38
1.85
Jul
4.89
1.80
2.72
-3.11
1.60
1.83
  Cumulative, % - August=100
 Sep-2020
3.61
0.97
3.72
5.02
-9.56
-3.36
Oct
6.26
3.13
2.00
13.59
-17.27
-2.01
Nov
9.91
5.50
1.80
6.56
5.10
1.43
Dec
14.39
6.81
2.11
1.26
14.40
6.46
Jan-2021
17.81
8.61
2.07
-0.50
23.41
9.25
Feb
19.98
9.60
2.08
1.03
46.05
16.32
Mar
24.01
10.77
2.23
12.21
40.33
13.82
Apr
27.26
12.63
2.16
12.62
48.52
23.25
May
32.27
13.63
2.37
15.44
53.09
26.61
Jun
36.61
15.84
2.31
18.47
65.92
28.95
Jul
43.29
17.93
2.41
14.79
68.57
31.32
                                     Index numbers and rate of changes in the consumer price index, 2005=100
 Jan
Feb
Mar
Apr
May
Jun
Jul
Aug
Sep
Oct
Nov
Dec
2019
398.07
398.71
402.81
409.63
413.52
413.63
419.24
422.84
427.04
435.59
437.25
440.5
2020
446.45
448.02
450.58
454.43
460.62
465.84
468.56
472.61
477.21
487.38
498.58
504.81
2021
513.30
517.96
523.53
532.32
537.05
547.48
557.36
Monthly rate of change (%)
2019
1.06
0.16
1.03
1.69
0.95
0.03
1.36
0.86
0.99
2
0.38
0.74
2020
1.35
0.35
0.57
0.85
1.36
1.13
0.58
0.86
0.97
2.13
2.30
1.25
2021
1.68
0.91
1.08
1.68
0.89
1.94
1.80
Annual rate of change (%)
2019
20.35
19.67
19.71
19.5
18.71
15.72
16.65
15.01
9.26
8.55
10.56
11.84
2020
12.15
12.37
11.86
10.94
11.39
12.62
11.76
11.77
11.75
11.89
14.03
14.6
2021
14.97
15.61
16.19
17.14
16.59
17.53
18.95
                                                           4.3 Industrial sectors and trade 4.3.1 PMI Production dynamics
4.3.2 Corporate profits dynamics
    PMI rose to 54 in July from 51.3 in June. Efforts to secure inputs were hampered by ongoing disruption to supply chains. Problems with shipping containers and difficulties sourcing raw materials had led their suppliers’ delivery times to lengthen. The rate of input cost inflation accelerated for the third month running, and was substantial. Respondents linked higher input prices to currency weakness and increases in raw material costs. In turn, firms raised their own selling prices at a marked pace.
      Koc Holding (KCHOL) reported a TRY5.31bn($632mn) net profit for H1, up
  22 TURKEY Country Report September 2021 www.intellinews.com
