
Page 35 - RUSRptApr17
P. 35
4.4 Fixed investment
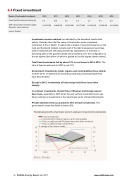
Russia -Fixed capital investment 2010 2011 2012 2013 2014 2015 2016
Fixed Capital investment change y/y
6.3 10.8 6.8 0.8 -2.7 -8.4 -0.9
GDP: Gross fixed investment capital formation, (local currency)
10,472,700 13,982,500 15,223,900 15,077,000 16,436,100 17,266,200 18,112,400
source: Rosstat
Investment remains subdued , as indicated by the downbeat construction activity. Rosstat notes that the value of construction works completed contracted -5.0% in March. It seems that a stream of new debt issuance on the local and Eurobond markets remains part of the debt management exercises, while investments are still being checked by expectations of a decline in borrowing rates in the quarters ahead and uncertainty over the configuration of the tax system (the reform of which is guided at, but the signals remain mixed).
Total fixed investments fell by about 12% in real terms in 2014–2016. T he ratio of fixed investments to GDP is just 21%.
Government investments (state, regions and municipalities) have shrunk.
In 2015–2016, investments of domestic private and joint private-state firms have also declined.
Except in 2015, investments of fully foreign-held firms have fallen sharply.
In contrast, investments of joint firms of Russian and foreign owners have risen, especially in 2016 when the joint venture investment boom was driven entirely by investments in the natural gas sector (Yamal LNG project).
Private domestic firms accounted for 55% of total investments. The government's share has fallen to below 20%.
35 RUSSIA Country Report April 2017 www.intellinews.com
