
Page 10 - GEORptFeb19
P. 10
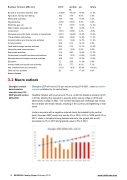
Business Turnover [GEL mn]
Q3 18
21,829 102 194 2,332 715
72 1,874 9,610 1,409 531 269 263 435 315 369 389 72 252 3,120 39
Jan-Sep y/y 18
59,732 18.5% 319 9.6% 559 15.5% 6,676 9.9% 2,375 12.2% 196 10.2% 4,988 3.4% 26,825 14.9% 3,820 12.5% 1,328 14.7% 614 14.2% 713 15.1% 1,249 2.8% 883 18.6% 1,012 10.9% 910 16.2% 269 11.6% 777 9.5% 7,435 93.8% 111 17.6%
Q3 y/y
17.3% 2.9% 5.3% 0.4% 14.4% 5.1% -4.4% 12.0% 11.3% 11.9% 8.8% 15.2% 2.0% 17.9% 10.2% 13.0% 9.6% 7.1% 136.6% 9.0%
By kind of economic activities, total Agriculture, forestry and fishing Mining and quarrying Manufacturing
Electricity, gas, etc
Water supply; sewerage, etc
Construction
Wholesale and retail trade; services to households Transportation and storage
Accommodation and food service activities Accommodation
Food and beverage service activities
Information and communication
Real estate activities
Professional, scientific and technical activities Administrative and support service activities Education
Human health and social work activities
Arts, entertainment and recreation
Other service activities
Source: Geostat
3.2  Macro outlook
Georgia’s central bank baseline scenario sees 5% GDP growth across 2019-2021
Georgia’s GDP will rise by 5% per annum during 2019-2021, under a   baseline scenario   published by its central bank.
Headline inflation will hover around 3% p.a. under the baseline scenario (2.9% in 2019), allowing the regulator to ease its policy rate by 0.5pp in 2019 and 2020 and by 0.25pp in 2021. The nominal Georgian lari exchange rate versus the US dollar will remain steady, resulting in the currency strengthening in real terms.
Under a scenario with a negative external shock formulated by the central bank, Georgian GDP would only rise by 2% in 2019, 2.5% in 2020 and 3.5% in 2021. Under a compiled strong demand scenario, the growth rate would accelerate to 6% in 2019 and gradually ease to 5% in 2021 .
10  GEORGIA Country Report  February 2019    www.intellinews.com
