
Page 12 - IRANRptJul18
P. 12
year the services sector registered the highest growth of all sectors, registering 6.8%. Agriculture and industry grew by 1% and 1.6%, respectively, it added.
4.0 Real Economy
Iran - Main Macro Indicators
2011 2012 2013 2014 2015 2016 2017
Annual GDP (y/y)
3.8 -6.6 -1.9 4.3 4.4 12.5 4.3
GDP (per capita) (USD)
6,563.55 7,719.77 7,931.07 6,007.46 5,579.25 4,899.68 5,230.09
GDP: Final consumption expenditure: Private (IRR bn)
2,654,281 3,208,428 4,505,167 5,262,427 5,656,000 6,236,000 7,032,000
GDP: Final consumption expenditure: Government (IRR bn)
578,400 713,990 868,334 1,160,266 1,301,000 1,700,000 1,952,000
GDP: Gross fixed capital formation, (IRR bn)
1,529,548 1,809,515 2,386,025 3,048,276 2,606,000 2,552,000 2,885,000
GDP: Exports, (lRR bn)
474,863 473,222 376,386 376,240 421,236 / /
GDP: Imports, (IRR bn)
496,227 449,701 345,821 281,210 265,210 / /
Source: CEIC; Central Bank of Iran
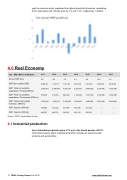
4.1 Industrial production
Iran’s industrial production grew 3.7% y/y in the fourth quarter of 2017,
CEIC data showed. Major industrial production includes oil, petrochemical products and automobiles.
12 IRAN Country Report July 2018 www.intellinews.com
