
Page 15 - BELRptApr19
P. 15
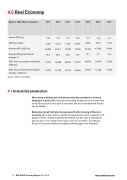
4.0  Real Economy
Belarus - Main Macro Indicators 2011 2012 2013 2014 2015 2016 2017
Annual GDP (y/y)
5.54 1.73 1.07 1.59 -3.9 -2.8 2.4
GDP (per capita) 6,306 6,722 7,722 8,040 5,949 5,023 5,732
Nominal GDP, (USD mn) 62,929 65,611 75,389 78,594 56,503 47,836 54,381
Nominal GDP growth (annual 76.5 88.6 22.9 15.8 12.1 5.7 10.6 average), %
GDP: Final consumption expenditure, 39,417 39,698 48,603 51,961 40,003 35,479 37,829 (USD mn)
GDP: Gross fixed investment capital 22,372 21,342 27,376 26,004 16,091 12,192 13,559 formation, (USD mn)
Source: CEIC, World Bank
4.1  Industrial production
After doing relatively well industrial production stumbled in January slowing to a mere 0.9%.  Industry was slowing all last year as the year wore on and the outlook for this year is uncertain until the oil tax talks with Russia can be settled.
Belarusian growth will also be depressed by the slowing of Russia’s economy  and a slow down in western Europe. Russia put in a surprise 2.3% growth in 2018, recently confirmed by Rosstat, but this year is expected to grow by only 1.3%. Growth won’t rise to over 3% until 2021, according to Russia’s Economics Ministry and Belarus will struggle in the meantime.
15  BELARUS Country Report  April 2019    www.intellinews.com
