
Page 32 - RusRPTJul19
P. 32
4.4 Fixed investment
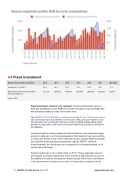
Russia -Fixed capital investment 2012 2013 2014 2015 2016 2017 Mar-2018
Investment (% of GDP)
24.3 22.9 22.0 21.4 22.5 23.5 15.3
GDP: Gross fixed investment capital formation (USD mn)
471,337 496,982 428,573 276,240 280,350 342,294 58,303
source: CEIC
Fixed investment remains very subdued. Fixed investment was heavy in February and March at over RUB17bn but fell off sharply in April to RUB2,6bn and remained subdued in May at the same level.
The RUB25.7 trillion ($390bn) investments planned for the 12 national projects has nominally begun but debates in the Duma in May and June made it clear the real work has yet to begin and there is still a heated debate about which projects to begin with. Little money has been disbursed and this is reflected in the statistics.
Investment activity remains weak and is dominated by a few state-lead mega- projects to date such as the big gas pipelines that Gazprom has been building to China and Turkey. So far these have been ad hoc projects lead by the state, but under the national projects programme, lead by VEB.RF (formerly Vneshtorgbank), this whole process is supposed to be institutionalised, but it clearly has yet to begin.
Fixed increasing by 4.1% in 2018 (4.8% in 2017). This is especially relevant with respect to private investments, which must be a vital indicator not only of the stability of economic development itself, but also of the level of confidence in the government’s socioeconomic policy. Foreign direct investment in the
32 RUSSIA Country Report July 2019 www.intellinews.com
