
Page 60 - RusRPTJul19
P. 60
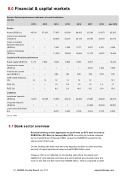
8.0 Financial & capital markets Russia -Selected performance indicators of credit institutions
(LC bn) Assets
2012
2013 2014 2015
57,423 77,653 83,000
/ 29,536 33,301 30,135 30,193
/ 1,306 1,659 2,777 3,627 / 11,330 10,684 10,804 12,174
Assets (RUB bn) 49,510
Loans to non-financial institutions /
Loans to resident
financial institutions
(RUB bn) /
Loans to individuals
(RUB bn) /
Capital and financial performance
80,063 85,192
Equity capital (RUB bn) 6,113 7,064 7,928 9,009 9,387 9,397
Provision for losses
(RUBbn) ///// 6,916
Profit for the current year (RUB bn)
CAR capital adequacy (%)
ROA (%)
ROE (%)
Liabilities
Individuals’ deposits (RUB bn)
/ / 589 192 930 790 14 13 12 13 13 12
/ / / /
14,251 16,958
1.0 0.0 1.0 8.0 2.0 10.0
18,553 23,219 24,200
1.0 8.0
25,987 24,843 2,016
Corporate deposits
(RUBbn) / / / /
Loans from CBR (RUB
bn) / / 9,287 5,363 2,726
source: CBR
8.1 Bank sector overview
Russian banking sector aggregate net profit was up 60% year-on-year to RUB867bn ($13.8bn) in January-May 2019, according to the data released by the Central Bank of Russia (CBR), versus the RUB527bn posted for the same period of last year.
On the funding side both retail and corp deposits continue to climb and they are both of equal importance being around RUB28 trillion each.
However, this is not reflected on the lending side where the assets and liabilities of corp deposits and loans are well matched as corporate loans are more or less flat at a little more than RUB30 trillion. That is compared to retail
60 RUSSIA Country Report July 2019 www.intellinews.com
2016 2017
2018
91,973 33,372
4,321 14,901
7,624 1279
1.4 12.4
28,460 25,504 2,710
Apr 2019
92,363 33,516
4,384 15,846
10,234 7,093 750 12.1
1.7 15.6
28,810 26,891 2,597
