
Page 24 - RusRPTMay19
P. 24
3.0 Macro Economy 3.1 Macroeconomic overview
The State Statistics Service has published GDP data for the fourth quarter of 2018 and revised the data for the first three quarters such that it is now more in line with the 2.3% estimate of GDP growth in the full year 2018.
Russian GDP rose 2.7% y/y in the fourth quarter of 2018, up from 2.2% y/y in the third quarter of 2018, which was revised upward from a previous estimate of 1.5% y/y. The GDP figures were also revised upward for the first quarter of 2018 (from 1.3% to 1.9% y/y) and the second quarter of 2018 (from 1.9% to 2.2% y/y.
As expected, the changes were mostly due to revisions to investment activity, which was adjusted upward in line with the previous adjustment to construction data. The annual estimate for investment growth was raised to 2.9% from the previous estimate of 2.3%. While the headline figure for 2018 GDP growth remained unchanged at 2.3%, other components of annual GDP growth from the expenditure approach were also slightly revised - export growth was revised from 6.3% to 5.5% y/y, import growth from 3.8% to 2.7% y/y and household consumption growth from 2.2% to 2.3%.
According to the recent GDP production statistics, the production of mining and the services it requires, as well as the civil and defence administration, have grown fastest in the last three years in the major sectors of the economy. The trade and transportation and storage have gradually recovered in the last two years and construction last year. Growth in the processing industry a couple of years ago has slowed down. In GDP statistics, production is represented by the value added generated by the sectors. Among the least developed sectors are health care and social services, whose value added has fallen slightly in real terms in recent years. Budgetary increases in public finances for health care have been largely driven by wage increases, especially in 2018. In practice, the rise in wages has mainly been reflected in rising healthcare prices.
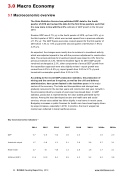
Key macroeconomic indicators "
2014 2015 2016 2017 2018
2M19 2019e
2020e
GDP
Industrial output Retail trade Inflation (EOP)
0.7 -2.5 -0.2 1.6 2.3 1.7 -0.8 1.3 2.1 2.9 2.7 -10 -4.6 1.3 2.6
11.4 12.9 5.4 2.5 4.3
- 1.5 2.3 2.6 2.7 3.1 1.8 1.7 3.1 5.2 4.2 3.8
24 RUSSIA Country Report May 2019
www.intellinews.com
