
Page 23 - RusRPTFeb20
P. 23
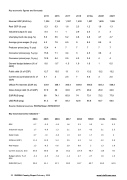
Key economic figures and forecasts
Nominal GDP (EUR bn)
Real GDP (% yoy)
Industrial output (% yoy)
Unemployment rate (avg, %)
Average gross wages (% yoy)
Producer prices (avg, % yoy)
Consumer prices (avg, % yoy)
Consumer prices (eop, % yoy)
General budget balance (% of GDP)
Public debt (% of GDP)
Current account balance (% of GDP)
Official FX reserves (EUR bn) Gross foreign debt (% of GDP) EUR/RUB (avg)
USD/RUB (avg)
2015 2016 1,224 1,160 -2.3 0.3 -3.4 1.1 5.6 5.5 4.2 7.9 12.4 4 15.6 7.1 12.9 5.4 -3.6 -3.7
12.7 13.5 5.1 2
339.1 358.1 37.9 39 68 74.1 61.3 67
2017 1,397 1.6
1
5.2 6.5 7 3.4 2.5 -1.5
13 2.5
360.4 32.8 65.9 58.3
2018 1,400 2.3 2.9 4.8
9 7 3 4.3 1.9
13 7
409.8 27.5 74 62.8
2018
2.3 2.9 2.8 4.3 6.8
2019e 1,507 1.2 2.5 4.8 8.5
7 4.5 3.5 1.9
13.2 4.6
486.5 28.2 73.1 64.8
5M19
0.5 4.3 1.7 5.1 2
2020f 1,605 1.6
3
4.7 8.5 7 3.6 4 1
13.2 3
504.3 25.9 73.2 64.7
2019e
1.1 2.1 1.5 4.2 1.3
2021f 1,595 1.3
3
4.7 8 7 4 4 0.5
13.2 2.5
508.3 24.6 77.9 66.5
2020e
2.3 2.5 2 3.8 1.8 93 1.6
64.5
Source: National sources, RBI/Raiffeisen RESEARCH
Key macroeconomic indicators "
2014 2015
2016 2017
-0.2 1.6 1.3 2.1 -4.6 1.3 5.4 2.5 0.6 2.9
GDP
Industrial output
Retail trade
Inflation (EOP)
Real wages
Current account, $ bn
Budget deficit, % of GDP
RUB/USD (avr)
0.7 -2.5 1.7 -0.8 2.7 -10 11.4 12.9 1.3 -9.5 59.5 69.6 -0.4 -2.5
38.4 61.1
25 35.2 114.9 48.7 118 -3.4 -1.4 2.7 2.7 1.9
23 RUSSIA Country Report February 2020
www.intellinews.com
67.1 58.3 62.7
65.7 65.3
