
Page 56 - RusRPTFeb20
P. 56
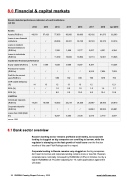
8.0 Financial & capital markets
Russia -Selected performance indicators of credit institutions (LC bn)
2012
2013
2014
2015
2016
2017
2018
Apr 2019
Assets
Assets (RUB bn)
49,510
57,423
77,653
83,000
80,063
85,192
91,973
92,363
Loans to non-financial institutions
/
/
29,536
33,301
30,135
30,193
33,372
33,516
Loans to resident financial institutions (RUB bn)
/
/
1,306
1,659
2,777
3,627
4,321
4,384
Loans to individuals (RUB bn)
/
/
11,330
10,684
10,804
12,174
14,901
15,846
Capital and financial performance
Equity capital (RUB bn)
6,113
7,064
7,928
9,009
9,387
9,397
10,234
Provision for losses (RUB bn)
/
/
/
/
/
6,916
7,624
7,093
Profit for the current year (RUB bn)
/
/
589
192
930
790
1279
750
CAR capital adequacy (%)
14
13
12
13
13
12
12.1
ROA (%)
/
/
1.0
0.0
1.0
1.0
1.4
1.7
ROE (%)
/
/
8.0
2.0
10.0
8.0
12.4
15.6
Liabilities
Individuals’ deposits (RUB bn)
14,251
16,958
18,553
23,219
24,200
25,987
28,460
28,810
Corporate deposits (RUB bn)
/
/
/
/
24,843
25,504
26,891
Loans from CBR (RUB bn)
/
/
9,287
5,363
2,726
2,016
2,710
2,597
source: CBR
8.1 Bank sector overview
Russia’s banking sector remains profitable and healthy, but corporate lending is sluggish as big companies are unwilling to borrow, while the regulator is stamping on the fast growth of retail loans over the first ten months of this year Fitch Ratings said in a report.
Corporate lending in Russia remains very sluggish as the big companies don't want to borrow and corporate lending remains more or less flat. Russia’s corporate loans nominally increased by RUB204bn (0.5%) in October, but by a higher RUB288bn (0.7%) after adjusting for 1% ruble appreciation against the US dollar.
56 RUSSIA Country Report February 2020 www.intellinews.com
