
Page 21 - GEORptDec20
P. 21
5.0 External Sector & Trade
5.1 Balance of payments, current account
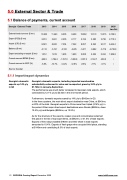
Georgia - External Trade 2013 2014 2015 2016 2017 2018 2019 2020* Jan-Oct
External trade turnover ($ mn)
10,933 11,463 9,505 9,459 10,802 12,741 13,315 9,159.5
Export (FOB) ($ mn)
2,910 2,861 2,205 2,117 2,746 3,380 3,798 2,715.3
Import (CIF) ($ mn)
8,023 8,602 7,304 7,342 8,057 9,362 9,517 6,444.2
Balance ($ mn)
-5,112 -5,741 -5,100 -5,225 -5,311 -5,982 -5,719 -3,728.9
Export excluding re-export ($ mn)
1,812 1,819 1,603 1,620 2,008 2,226 2,324 1,956.8
Current account BPM6 ($ mn)
-955.5 -1,784.2 -1,767.0 -1,885.8 -1,307.5 -1,192.7 -900.5 /
Current account to GDP (%)
-5.8% -10.7% -12.2% -12.9% -8.8% -7.7% -5.1% /
Source: Geostat
5.1.1 Import/export dynamics
Georgia’s domestic exports up 14% y/y in Q3
Georgia’s domestic exports, including imported merchandise substantially enhanced in value and re-exported, grew by 2.8% y/y to $1.72bn in January-September.
The performance was much better compared to Georgia’s total exports, which contracted by 12.1% y/y to $2.4bn in the nine-month period.
Furthermore, domestic exports soared by 14% y/y to $642mn in Q3.
In the three quarters, the main direct export destination was China, at $343mn, or 20% of the total. Georgia’s exports to China more than tripled (214% y/y) in the period. Other major direct export destinations were Russia ($280mn, down 12.4% y/y) and Bulgaria ($228mn, up 13.5%).
As for the structure of the exports, copper ores and concentrates reclaimed first place in the list of top export items, at $542mn, or 31.5% of total exports. Exports of ferro-alloys totalled $180mn and their share in total exports amounted to 10.4%. Exports of fresh grape wine occupied third place, standing at $143mn and constituting 8.3% of total exports.
21 GEORGIA Country Report December 2020 www.intellinews.com
