
Page 13 - GEORptNov18
P. 13
Georgia’s Business Confidence Index deteriorates 4.2pp q/q in Q3
to 7.84, as administrative requirements and extra payments/bribes/favouritism remained substantial problems with scores of below 7 and falling.
Georgia’s Business Confidence Index as calculated by ISET Research deteriorated by 4.2pp q/q to 35.4 index points in Q3, driven by both falling expectations and a worsening of experienced performance in many business sectors, Georgian Business Consulting reported on September 18. Managers’ expectations remained, however, close to the past year’s highest point, at 64.2% index points.
Compared to other sectors, manufacturing assessed past performance and expectations the most pessimistically. In contrast, the agriculture sector was the most positive, reflecting the high season in production.
The Past Performance Index, which reflects businesses' assessment of their own economic performance in the previous quarter, showed a steep downward trend, decreasing by 3.4 points in Q3.
The Expectation Index, which reflects managers’ projections, decreased at a slower rate and remained at a high level of 64.2 index points. Other than manufacturing, the retail trade and financial sectors contributed the most to this decrease in business optimism.
The Sales Price Expectation Index decreased moderately as well, but still stood higher than last year's expectations. Businesses in the service and construction sectors predict high price increases in the next quarter.
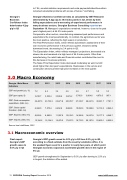
3.0 Macro Economy
Georgia - Main Macro 2011 2012 2013 2014 2015 2016 2017 1Q18 Indicators
GDP real growth (y/y, %)
7.2 6.4 3.4 4.6 2.9 2.7 5.0 5.3
GDP (per capita, $) 3,230.7 3,523.4 3,599.6 3,676.2 3,766.6 3,864.6 4,078.5 987.1
GDP: Final consumption expenditure, (GEL mn)
22,487.3 23,733.2 23,671.8 25,570.7 27,318.7 28,241.5 30,381.7 7,781.1
GDP: Gross capital formation, (GEL mn)
6,368.0 7,575.4 6,652.9 8,688.8 10,004.3 10,999.8 12,133.3 2,842.4
GDP: Exports, (GEL mn)
8,822.8 9,982.9 11,997.9 12,518.3 14,206.8 14,837.8 19,177.3 4,549.7
GDP: Imports, (GEL mn)
13,334.2 15,124.2 15,475.2 17,627.3 19,774.3 20,187.5 23,650.1 6,022.9
Source: bne IntelliNews, CEIC
3.1 Macroeconomic overview
Flash report: Georgia’s GDP growth eases to 4.0% y/y in Q3
Georgia’s GDP growth eased to 4.0% y/y in Q3 from 5.5% y/y in Q2, according to a flash estimate from the country’s statistics office. It is the weakest figure seen for a quarter in nearly two years, at which point Georgian economic expansion accelerated growth rates in the region of 5% y/y.
GDP growth strengthened in September to 5.6% y/y after slowing to 2.0% y/y in August, the statistics office added.
13 GEORGIA Country Report November 2018 www.intellinews.com
