
Page 26 - Redbrik: Property and marketing Autumn/Winter 2019
P. 26
STATS 26
THE PROPERTY MARKET BY NUMBERS
Who doesn't love a good stat? We have pulled together a number of interesting property facts and figures for you to enjoy.
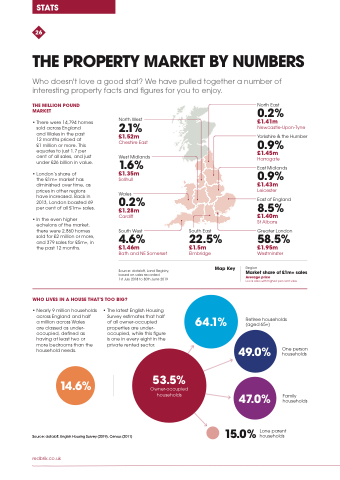
THE MILLION POUND MARKET
• There were 14,794 homes North West sold across England 2.1%
and Wales in the past
12 months priced at
£1 million or more. This
equates to just 1.7 per
cent of all sales, and just West Midlands under £26 billion in value. 1.6%
• London’s share of £1.35m the £1m+ market has Solihull diminished over time, as
prices in other regions Wales
have increased. Back in 0.2% 2013, London boasted 69
per cent of all £1m+ sales. £1.28m
Cardiff
Bath and NE Somerset Elmbridge
£1.52m
Yorkshire & the Humber
Cheshire East
0.9%
• In the even higher
echelons of the market,
there were 2,860 homes South West South East sold for £2 million or more,
and 379 sales for £5m+, in
the past 12 months. £1.46m £1.5m
£1.40m
St Albans
WHO LIVES IN A HOUSE THAT'S TOO BIG?
• Nearly 9 million households across England and half
a million across Wales
are classed as under- occupied, defined as having at least two or more bedrooms than the household needs.
14.6%
• The latest English Housing Survey estimates that half of all owner-occupied properties are under- occupied, while this figure is one in every eight in the private rented sector.
Retiree households (aged 65+)
Source: dataloftft, English Housing Survey (2019), Census (2011)
redbrik.co.uk
4.6% 22.5%
Greater London
Source: dataloft, Land Registry, based on sales recorded
1st July 2018 to 30th June 2019
Map Key
Region
53.5%
Owner-occupied households
Family households
£1.95m
Westminster
Market share of £1m+ sales
Average price
Local area with highest per cent sales
64.1%
49.0%
47.0%
15.0% Lone parent households
North East
0.2%
£1.41m
Newcastle-Upon-Tyne
£1.45m
Harrogate
East Midlands
0.9%
£1.43m
Leicester
East of England
8.5%
58.5%
One person households
