
Page 18 - 2020 GSABA Housing Forecast Magazine
P. 18
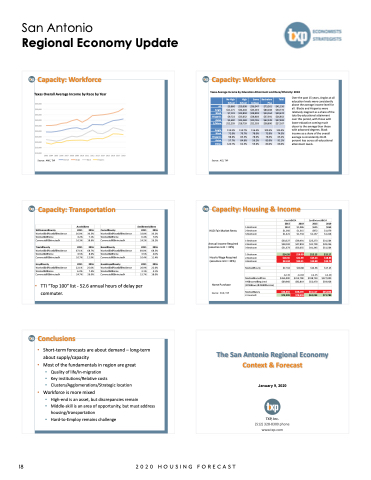
                                                San Antonio
Regional Economy Update
    Capacity: Workforce
Texas Overall Average Income by Race by Year
$55,000 $50,000 $45,000 $40,000 $35,000 $30,000 $25,000 $20,000 $15,000 $10,000
Source: AMC, TXP
           2003 2004 2005 2006 2007 2008 2009 2010 2011 2012 2013 2014 2015 2016 2017 2018
Overall Anglo Black Hispanic
   Capacity: Workforce
Texas Average Income by Education Attainment and Race/Ethnicity: 2018
Black
Hispanic
Asian
2/More
Anglo
Black
Hispanic
Asian
Other
Source: ACS, TXP
$11,171
$7,101
$9,722
$5,692
$12,293
113.3%
72.0%
98.6%
57.7%
124.7%
High School
$34,404
$23,894
$25,652
$25,369
$18,759
114.7%
79.7%
85.5%
84.6%
62.5%
Some College
$43,019
$28,803
$28,803
$20,765
$22,033
116.4%
78.0%
78.0%
56.2%
59.6%
$80,208
$54,164
$57,391
$62,249
$58,890
109.5%
73.9%
78.3%
85.0%
80.4%
$50,774
$30,674
$26,852
$37,483
$27,167
123.4%
74.5%
65.2%
91.1%
66.0%
Over the past 15 years, Anglos at all education levels were consistently above the average income level for all. Blacks and Hispanics were relatively stagnant as a share of the total by educational attainment over this period, with those with lower education coming much closer to the average than those with advanced degrees. Black income as a share of the overall average is consistently 20-25 percent less across all educational attainment levels.
 Anglo
All
No High School
$9,860
$29,998
$36,947
Bachelors Plus
$73,261
Total
$41,156
 19 20
   Capacity: Transportation
TTI “Top 100” list - 52.6 annual hours of delay per commuter.
WilliamsonCounty
WorkediinPlaceofResidence
WorkedatHome
Commute45minutes+
TravisCounty
WorkediinPlaceofResidence
WorkedatHome
Commute45minutes+
HaysCounty
WorkediinPlaceofResidence
WorkedatHome
Commute45minutes+
AustinArea
2011
26.0%
6.2%
16.3%
2011
67.1%
6.5%
10.7%
2011
22.1%
6.3%
24.7%
2016
30.5%
7.1%
18.6%
2016
68.7%
8.0%
12.9%
2016
25.0%
7.4%
26.0%
ComalCounty
WorkediinPlaceofResidence
WorkedatHome
Commute45minutes+
BexarCounty
WorkediinPlaceofResidence
WorkedatHome
Commute45minutes+
GuadalupeCounty
WorkediinPlaceofResidence
WorkedatHome
Commute45minutes+
SanAntonioArea
  2011
32.8%
6.4%
24.2%
2011
69.0%
3.5%
10.4%
2011
20.9%
3.1%
15.7%
2016
33.2% 7.6% 26.2%
2016
68.5% 4.0% 11.4%
2016
22.0% 4.1% 18.0%
         Capacity: Housing & Income
           HUD Fair Market Rents
Annual Income Required (assumes rent = 33%)
Hourly Wage Required (assumes rent = 33%)
Home Purchase Source: HUD, TXP
1-Bedroom
$14.58 $18.99
$12.15 $15.17
1-Bedroom
 2-Bedroom
 3-Bedroom
  1-Bedroom
 2-Bedroom
 3-Bedroom
AustinMSA
2015
$834
$1,050
$1,421
$30,327
$38,182
$51,673
2019
$1,086
$1,315
$1,734
$39,491
$47,818
$63,055
SanAntonioMSA
2015
$695
$872
$1,137
$25,273
$31,709
$41,345
2019
$868
$1,079
$1,418
$31,564
$39,236
$51,564
    2-Bedroom
 $18.36 $22.99 $15.24 $18.86 $24.84 $30.31 $19.88 $24.79
 3-Bedroom
 MedianHourly
$17.62
$18.88
$14.96
$17.25
Jul-15
Jul-18
Jul-15
Jul-18
MedianHomePrice
$265,000
$313,708
$198,750
$227,000
HHIncomeRequired
$69,960
$82,819
$52,470
$59,928
(20%down,33%ofincome)
 MedianSalary 2-Income
  $36,650
$73,299
$39,279 $78,559
$31,117
$62,234
$35,890
$71,780
                                  •
21 22
23
   Conclusions
• Short-term forecasts are about demand – long-term about supply/capacity
• Most of the fundamentals in region are great
• Quality of life/In-migration
• Key institutions/Relative costs
• Clusters/Agglomerations/Strategic location
• Workforce is more mixed
• High-end is an asset, but discrepancies remain
• Middle-skill is an area of opportunity, but must address
housing/transportation
• Hard-to-Employ remains challenge
   The San Antonio Regional Economy
Context & Forecast
January 9, 2020
TXP, Inc.
(512) 328-8300 phone www.txp.com
 18
2020 HOUSING FORECAST
