
Page 36 - Final Approved 2017-2018 Student Accommodation Plan 2017-03-29
P. 36
Facilities Services / DGL
NotGeo-Located 2 1 - - - - - 1 1 1 - 1 - - 3 - - - - 1 - - - - - - - 1 2 4 2 1 - - - 1 2 - - - - - - - 7 2 - 4 1 1 1 - 1 - 1 17
Data Analysis October 26, 2016 Board Approved March 28, 2017
Students' School of Residence
2 13 4 Andersen 597 232 2 1
Total Number of Students Resident in Boundary
Allen 580 4
46
8 10 55 747
Atlantis158033120 Audubon 523 2 1 7
Cambridge 7 17476 61 Cape View 640141 Carroll 2 12 15651 Challenger 7 16 1 449
Columbia
Coquina 407 6
Creel 6 Croton 5
Discovery
Endeavour 14 312932
24332 1 1
9 5 9
11
8
2 1
9 640 32 601 - 499 3 712 53 566 7291841 75 686 8 18 1004 6 27 732 21 133 803 169 1278 1 41 549 24 813 -429 54 703 14 32 472 1248711-334
Enterprise 119 1
Fairglen 5 15 661
Gemini1
Golfview 43 66
Harbor City 5 Holland
Imperial Estates 153 Indialantic 1
1 18 7 19
3 2
1 1
1
5
523 516 2 2 8 435233 8
308 2
16126311
10 4734 2
1 4 2
481
1 2
17
2
534
622 481
35 4 4
McAuliffe 1 Meadowlane Primary 1
Meadowlane Intermediate 4
Mila 1 1
Mims 92 Oak Park 202
Ocean Breeze 1 Palm Bay El.
Pinewood 41 Port Malabar
Quest 1 Riviera 5 1
Roosevelt
Sabal 9
Saturn 8 5 SeaPark 1 2
Sherwood 3 Sunrise1 Suntree 1
12 11 21
11 112
13 1
3
5 34 1
512 1 16
14 39 317
4
1 5 8 4 5 6
51 31
684 8 1 439
18 660 24 17
1
4 4 28 14 2 4
12
799 530 741
1
1 855
Surfside
Tropical 2
Turner
University Park 7
Westside 1
Williams 2
Not Geo-Located 2 1
Total Number
of Students 632 701
17
599
640 523 117
599 523
76
291
4 6
18 4
2 2
4 12 5176 1
15
2 3
339
13701 3184 10
896
871 1025 1041
601
59
39,483
39,424 30,114 9,310
- 39,483
30,114 9,369
59
59
Page 1 of 1
Attending School
Students Resident within School Boundary
Resident Students Attending School Resident Students
815
857 725 132
815 725
648
719 580 139
648 580
68
111
660 525 544
712 566 841 565 449 496 147 117 345
660 525 544 565 449 496
95 76 48
523
543
549 447 102
543 447
96
619
703
401 466
472 334 352 308
718
766
751
807 734
793 726
1,137 727 745 587
683 864
570 1,136 472 798
922
1,014 853
900 647
1,122 988 855 617
359 550 763
580 597 Out-of-Area-Out 146 150
421
141 8 187 120 26 135 73 392 140 98 338 225 177 207 141 125 161 89 249 43 227 267 371 116 178 188 136 165 155 81 45 195 296 521 383 100 - - - -
TO Other Schools
Total Students Attending School Resident Students Attending School
632 701 580 597
703 451 672 421
619 401 516 352
466 718
308 631 734 745
726 683 864 587 472 798
786 748 1,010 534 485 717 696 973 481 437
922 519 853 499
799 530 741 684 439 660
900 647 855 617
359 550 763 339 485 841 657 475 787 631 546 712 581 409 484 550 4,194 324 495 679 287 387 738 569 400 701 575 504 658 501 - - - -
Non-Resident Students
Out-of-Area-In 52 104 90
31 30 103 49 158 87 17 48 139 211 66 69 52 37 53 48 69 20 115 91 81 45 30 35 55 84 52 98 103 88 75 86 56 42 54 80 409 484 550 4194
FROM Other Schools
Net Out-of-Area-In Minus Out-of-Area-Out
(94) (46) (42) (71) (41) 39
(73) (52) (41) (297) (163) (66) (117) (178) (388) (6) (110) 22 (84) (71) 132 (48) (56) (344) (1) 113 (272) (156) (125) (170) (88) (77) (92) (69) (134) 48 (146) (222) (341) (81) (123) (104) (84) (67) (52) 7 30 (109) (240) (479) (329) (20) 409 484 550 4194
726 747
686 1,004 499 811 187 193
523 938 499 811
24 127
732 803 1,278 560 588 852 172 215 426
615 625 890 560 588 852
55 37 38
933 684
482 887 439 660
440 673 867 423 552 893 650 445 896 871 1,025 1,041 601 324 495 679 287 387 738 569 400 701 575 504 658 501
314
7
703
813 672
1
1
485
562 437
4 679
34 5387 16
1
640
601 476 125
640 476
164
2
10 1
1
2
3 14287621
2
426
499 401 98
426 401
25
1 4 11 2 3
1
938 615 625
3
1 14 4
17 1 1 412
12 575 1 7 13 5 504 1 27 6 658
1 31
7 2 4111
485 841 657 475 787 631 546 712
12 214 3 51 330 18 277 50111 74 1117
581 409 484 550 4,194
1
1
8 1
3
41 25
1
2 1
1 1
1 3 1
4
1,010
1,180 973
3 116
2 4 19
2 2
7 4 1
4 3
2 1
1
4 7
1
21 1
101 46 43
12
786 748
942 873
7
1
1569 28534650
496
2 1
51
524
14
53
13
1
1
1133 2 1 6
1
499
2
4 1 1 1 20
661
121 42 24 10 100
1 3 2
11 5
5
4 2 27
3
1 3
86
31 1
3
890
1 4 1 1 20 2
6 6 2
7
2 24
257
1 1
2 1
2 6
451
429
1
499
1 2 3
1
519
588 499
1
12
1 1
1400 1621445
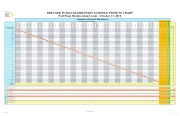
BREVARD PUBLIC ELEMENTARY SCHOOLS: FROM TO CHART Fall Final Membership Count - October 17, 2016
Students' School of Enrollment Brevard District Schools
Choice Schools
Charter
NET FROM TO
Allen
Andersen
Apollo
Atlantis
Audubon
Cambridge
Cape View
Carroll
Challenger 7
Columbia
Coquina
Creel
Croton
Discovery
Endeavour
Enterprise
Fairglen
Gemini
Golfview
Harbor City
Holland
Imperial Estates
Indialantic
Jupiter
Lockmar
Longleaf
Manatee
McAuliffe
Meadowlane Primary
Meadowlane Intermediate
Mila Mims
Oak Park Ocean Breeze Palm Bay El. Pinewood Port Malabar Quest Riviera Roosevelt Sabal Saturn
Sea Park Sherwood Sunrise Suntree Surfside Tropical Turner University Park Westside Williams Freedom 7 Stevenson West Melbourne Charter Schools
1 1526 261 10 Apollo7253224119 1
5
6221
11 3
111 4
3
33 726 71 857
6 65 719
2 1 2
1 34 1
4 3
811 22 2
47 560
1 588
852 2 54 447 4 2 11 16 672 2
1 1
62
34
512 31 2
59 1 32 4301
11
1 1 3
1
2
6 2
1
8 14212
31
11 11 4
21 97
1
5
4
Jupiter
Lockmar
Longleaf Manatee8412111798
5 2
11
7130
1 10
5 6
13 1
2 2
1 74530 7 587
3 1
442 5111
21
1
12 472
8 222 5
5612 1862 1 1122 111 3
1
1
18
2 20 2
3
14
2
2
3
1 1 1
1
4 14
35 1 4
1
1 1
1
2
1 18
13
516
631
717 696
- -
- -
751 793
2 3 2
1 2
1 1242
413 1
71712 7 696 22973
122
214
1
16
437 19 19 853
184
8
31 2 4 1
87 111
3 4 4
2
96 10 8
2 1
3
2 1 1 12 732 1 10 214
6
1 1
3 1
1 2
2 43
741 42 22
5 19
1 3
3 10 3
2
1 617
4 1 8 9
2 10 2 2
90 766 107807 24 271 1137 13 80 727 15 42 570 71292522461136
82 161
21
662
25 137 942 1 58 67 873 110263 1180 4 58 12 622 21 562 3 69 1014 30 7 4 588 16 178 933 12 482 1 12 136 887 32 3 6 166 1122 1 33 230 988 75 10 1 440 15 1 23 19 673 6 32 45 867 345423 9 1 7 32 552 341738186119893
324
495
221 2
1 4 7
4
3 13 3 4 2 2
1
3
5 12
29
