
Page 43 - Final Approved 2017-2018 Student Accommodation Plan 2017-03-29
P. 43
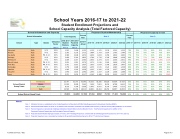
School Years 2016-17 to 2021-22
Student Enrollment Projections and
School Capacity Analysis (Total Factored Capacity)
School Information and Capacity
Projected Student Membership
Projected Capacity in Use
School Information
Total Capacity
Current Year
(Note 4)
Current Year
(Note 5)
School
Type
Grades
Utilization Factor
(Note 1)
2016-2017 Student Stations
(Note 2)
2016-2017 Factored Capacity
(Note 3)
2016-17 Actual
2017-18
2018-19
2019-20
2020-21
2021-22
2016-17
2017-18
2018-19
2019-20
2020-21
2021-22
Astronaut
High
9-12
95%
1,522
1,446
1,132
1,124
1,125
1,159
1,233
1,314
78%
78%
78%
80%
85%
91%
Bayside
High
9-12
95%
2,353
2,235
1,712
1,684
1,733
1,697
1,705
1,789
77%
75%
78%
76%
76%
80%
Eau Gallie
High
PK, 9-12
95%
2,300
2,186
1,672
1,639
1,693
1,784
1,834
1,900
77%
75%
77%
82%
84%
87%
Heritage
High
9-12
95%
2,436
2,314
1,855
1,784
1,778
1,769
1,848
1,928
80%
77%
77%
76%
80%
83%
Melbourne
High
9-12
95%
2,439
2,317
2,304
2,300
2,374
2,471
2,466
2,601
99%
99%
103%
107%
106%
112%
Merritt Island
High
PK, 9-12
95%
2,015
1,915
1,574
1,575
1,516
1,583
1,646
1,739
82%
82%
79%
83%
86%
91%
Palm Bay
High
PK, 9-12
95%
2,751
2,613
1,637
1,635
1,659
1,786
1,820
1,897
63%
63%
64%
68%
70%
73%
Rockledge
High
9-12
95%
1,778
1,689
1,460
1,470
1,515
1,522
1,485
1,458
86%
87%
90%
90%
88%
86%
Satellite
High
PK, 9-12
95%
1,595
1,516
1,356
1,325
1,345
1,332
1,357
1,404
89%
87%
89%
88%
90%
93%
Titusville
High
9-12
95%
1,970
1,872
1,394
1,395
1,437
1,429
1,468
1,488
75%
75%
77%
76%
78%
80%
Viera
High
PK, 9-12
95%
2,371
2,253
2,117
2,150
2,188
2,233
2,235
2,337
94%
95%
97%
99%
99%
104%
School District Group Totals
Elementary
42,757
42,757
35,293
35,342
36,286
36,820
37,049
37,347
83%
83%
85%
86%
87%
87%
Middle
11,100
9,990
7,542
7,569
7,801
8,259
8,708
8,651
76%
76%
78%
83%
87%
87%
Jr / Sr High
8,216
7,396
6,058
6,042
6,091
6,259
6,469
6,615
82%
82%
82%
85%
88%
89%
High
23,530
22,356
18,213
18,081
18,363
18,765
19,097
19,855
82%
81%
82%
84%
85%
89%
School District Grand Totals
85,603
82,499
67,106
67,034
68,541
70,103
71,323
72,468
81%
81%
83%
85%
86%
88%
Notes:
Note 1: Note 2: Note 3:
Note 4: Note 5:
Utilization Factors are established by the Florida Department of Education's (FDOE) State Requirements for Educational Facilities (SREF).
Permanent Student Stations for 2016-17 are based on the information contained in the FDOE Florida Inventory of School Houses (FISH) database on 12/13/2016. Factored Capacity is calculated by multiplying Satisfactory Student Stations by the Utilization Factor. Total Factored Capacity is the addition of the
Permanent Factored Capacity plus the Relocatable Factored Capacity.
Projected Student Membership figures based on Finance 2017-18 Budget Projections combined with Growth Management Projections for 2017-18 to 2021-22. Projected Capacity in Use is calculated by dividing the Projected Student Membership by the 2016-17 Total Factored Capacity.
Facilities Services / DGL Board Approved March 28, 2017 Page 3 of 3
