
Page 64 - Final Approved 2017-2018 Student Accommodation Plan 2017-03-29
P. 64
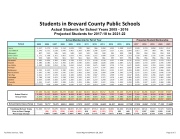
Students in Brevard County Public Schools
Actual Students for School Years 2005 - 2016 Projected Students for 2017-18 to 2021-22
Cocoa
Cocoa Beach
Edgewood
West Shore
Astronaut
Bayside
Eau Gallie
Heritage
Palm Bay
Rockledge
Satellite
Titusville
Viera
1,317
1,543
807
955
1,482
2,380
2,390
2,621
1,786
2,057
1,591
952
2,168
1,404
2,580
1,559
1,567
918
946
2,161
955
1,382
2,752
1,421
1,482
1,424
1,114
1,470
943
961
1,309
2,760
2,324
1,238
1,398
1,941
Actual Membership for Fall of Year
1,402
948
967
1,228
2,195
1,204
1,425
2,026
970
1,383
944
961
1,153
1,930
1,327
1,893
1,242
1,391
2,117
960
1,389
942
964
1,171
1,665
1,759
1,739
1,269
1,386
2,237
966
1,246
930
955
1,128
1,606
1,797
1,587
1,377
1,282
2,022
1,458
1,164
940
961
1,144
1,628
1,795
1,555
1,372
1,322
1,976
1,531
1,127
941
957
1,137
1,643
1,714
1,825
1,599
1,374
1,319
1,326
2,032
1,498 1,102
949
957
1,108 1,687
1,713 1,851 2,227
1,570 1,447
1,345 1,393 2,002
1,572
948
955
1,132
1,712
1,672
1,855
1,637
1,460
1,356
1,394
2,117
Projected Student Membership
School
2005
2006
1,272
2007
1,193
2008
2009
1,029
2010
2011
2012
2013
2014
2015
2016
2017
1,599
950
956
1,124
1,684
1,639
1,635
1,470
1,325
1,395
2,150
2018
1,724
950
956
1,125
1,659
1,515
1,437
2,188
2019
1,858
950
956
1,159
1,786
1,429
2,233
2020
2,012
950
956
1,233
1,705
1,820
1,485
1,468
2,235
2021
2147
1,551
1,528
1,064
1,017
976
969
961
956
950
Space Coast
2,171
1,962
1,833
1,742
1,650
1,552
1,498
1,528
1,474
1,519
1,520
1,485
1,526
1,590
1606
940
956
1314
1,733
1,697
1789
2,081
1,953
1,736
1,694
1,654
1,599
1,675
1,682
1,693
1,784
1,834
1900
932
1,784
1,778
1,769
1,848
1928
Melbourne
Merritt Island
2,291
1,697
2,342
2,274
2,190
1,545
1,981
1,997
1,967
1,508
1,945
1,501
2,013
1,499
2,131
1,594
1,545
2,304
1,574
2,300
1,575
2,374
1,516
2,471
1,583
2,466
1,646
2601
1,590
1,569
1,505
1,483
1739
2,577
2,529
2,108
1897
1,522
1458
1,669
1,450
1,259
1,200
1,165
1,169
1,272
1,290
1,345
1,332
1,357
1404
1488
2337
School District Group Totals
37,269
36,420
36,605
36,274
35,868
35,482
36,063
36,126
35,152
35,296
35,249
35,293
35,342
36,286
36,820
37,049
37,347
9,336
9,127
8,855
8,610
8,458
8,385
8,600
8,587
7,954
7,757
7,549
7,542
7,569
7,801
8,259
8,708
8,651
5,476
5,611
5,590
5,336
5,150
5,030
4,945
4,683
6,021
6,084
5,980
6,058
6,042
6,091
6,259
6,469
6,615
19,612
19,559
19,429
18,814
18,527
18,322
18,429
18,158
17,276
17,694
17,888
18,213
18,081
18,363
18,765
19,097
19,855
School District Grand Totals
71,693
70,717
70,479
69,034
68,003
67,219
68,037
67,554
66,403
66,831
66,666
67,106
67,034
68,541
70,103
71,323
72,468
Traditional School Totals
71,693
70,717
70,479
69,034
68,003
67,219
68,037
67,554
66,403
66,831
66,666
67,106
67,034
68,541
70,103
71,323
72,468
Year-to-Year Change
(58)
(975)
(238)
(1,445)
(1,031)
818
(483)
(1,151)
(723)
263
440
(72)
1,507
1,562
1,220
1,145
Percentage Change
-0.08%
-1.36%
-0.34%
-2.05%
-1.49%
1.22%
-0.71%
-1.70%
-1.07%
0.40%
0.66%
-0.11%
2.25%
2.33%
1.78%
1.63%
Facilities Services / DGL Board Approved March 28, 2017 Page 3 of 5
