
Page 3 - Shape the Future
P. 3
VISION
Brevard Public Schools will serve its community and enhance students’ lives by delivering the highest quality education in a culture of dedication, collaboration and learning.
MISSION
To serve every student with excellence as the standard.
Vision of Excellent Instruction
Brevard Public Schools provides equitable learning for all students, so that all students are prepared for success after graduation. Excellent instruction is at the heart of these learning experiences and is comprised of:
• Lessons that are consistently focused on complex content that appropriately challenges students to meet the subject and/or grade level standards
• Students who are supported to engage fully in the work of the lesson and to be responsible for doing the thinking that the lesson demands
• Learning environments that are safe, wel- coming, and encourage students to take the risks necessary to master the content
• Teachers who are intentionally planning and facilitating the learning through use of high quality, standards-aligned mate- rials, monitoring data, and collaborating with their school community
• Students who are demonstrating
that they are learning the content and applying their learning to new contexts and real-world problems
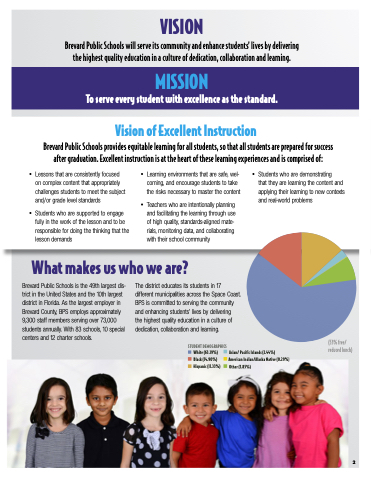
What makes us who we are?
Brevard Public Schools is the 49th largest dis- trict in the United States and the 10th largest district in Florida. As the largest employer in Brevard County, BPS employs approximately 9,300 staff members serving over 73,000 students annually. With 83 schools, 10 special centers and 12 charter schools.
The district educates its students in 17 different municipalities across the Space Coast. BPS is committed to serving the community and enhancing students’ lives by delivering
the highest quality education in a culture of dedication, collaboration and learning.
STUDENT DEMOGRAPHICS White (63.19%) Black (14.90%) Hispanic (11.33%)
Asian/ Pacific Islands (2.44%) American Indian/Alaska Native (0.29%)
Other (7.85%)
(53% free/ reduced lunch)
2
STUDENT DEMOGRAPHICS White (63.19%)
Asian/ Pacific Isl American Indian
Black (14.90%) Hispanic (11.33%)
Other (7.85%)
