
Page 17 - BPS PFAR Report Fiscal Year 12.17.2021
P. 17
FY21 Capital Assets
Land $ 36,311,529 Construction in Progress $ 76,764,592
Improvements Other Than Buildings $ Buildings and Fixed Equipment $
14,257,257
665,714,713
14,789,492
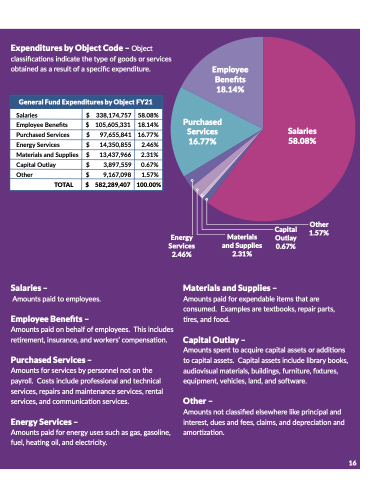
Expenditures by Object Code – Object Furniture, Fixtures, and Equipment $
classifications indicate the type of goods or services
Motor Vehicles $
13,430,025 199,096 821,466,704
Due in One Year
Purchased Services 16.77%
FY20
obtained as a result of a specific expenditure.
Employee Benefits 18.14%
AV Materials and Computer Softward
$
$
Salaries –
$ 21,023,916 $ 33,474,025
2.81% 4.47% 0.94%
$ 29,254,855 3.65% $ 35,538,045 4.45%
Food Services
$ 31,958,455 3.99% $ 33,097,406 4.15%
Amounts paid to employees.
Amounts paid for expendable items that are
TOTAL
General Fund Expenditures by Object FY21
Salaries
$ 338,174,757
58.08%
Employee Benefits
$ 105,605,331
18.14%
Purchased Services
$ 97,655,841
16.77%
Energy Services
$ 14,350,855
2.46%
Materials and Supplies
$ 13,437,966
2.31%
Capital Outlay
$ 3,897,559
0.67%
Other
$ 9,167,098
1.57%
TOTAL
$ 582,289,407
100.00%
Central Services $ 7,066,796
$ 7,486,774 0.94% $ 6,991,359 0.88%
Student Transportation $ 18,513,777
Amounts paid on behalf of employees. This includes
CommunityServices $ 1,857,871 0.25%
Capital Outlay –
retirement, insurance, and workers’ compensation.
$ 70,979,149 8.86% $ 43,752,638 5.48% Amounts spent to acquire capital assets or additions
4.70%
Energy Services –
Amounts paid for energy uses such as gas, gasoline, fuel, heating oil, and electricity.
Other Capital Outlay $ 35,188,247 Debt Service $ 37,207,223
$ 41,361,206 5.17% $ 35,665,339 4.47%
4.97% TOTAL $748,851,080 100.00%
Purchased Services –
to capital assets. Capital assets include library books,
Amounts for services by personnel not on the payroll. Costs include professional and technical services, repairs and maintenance services, rental services, and communication services.
$ 800,857,603 100.00% $ 797,773,935 100.00% audiovisual materials, buildings, furniture, fixtures,
Services and Supplies 0.67%
$ 12,084,142 1.61% $ 12,365,190 1.54% $ 14,892,441 1.87%
2.46% 2.31%
$ 39,788,528 5.31% $ 40,512,588 5.06% $ 40,523,926 5.08%
$co1n8s,0u4m2e,6d1.5Exam2p.l2e5s%aret$extb1o7o,2k8s7,,r2e3p5airpa2rt.s1,7% EOmpperlaotiyoene&Benefits– tires,andfood.
2.47% Maintenance of Plant $ 63,097,329 8.43%
Materials and Supplies –
equipment, vehicles, land, and software.
Other –
Amounts not classified elsewhere like principal and interest, dues and fees, claims, and depreciation and amortization.
Salaries 58.08%
FY21
Capital Other
Governmental Funds Expenditures
Instruction
Student Support GeneralAdministration School Administration Facilities Acquisition
& Construction
$ 68,868,465 8.60% $ 70,884,312 8.89% $ 1,959,259 0.25% $ 6,224,260 0.78%
FY19
$450,515,913 60.16% $451,475,522 56.37% $ 463,784,625 58.13%
Energy Materials Outlay
1.57%
$ 29,033,313 3.88% $ 26,593,525 3.32% $ 29,132,349 3.65%
16
