
Page 8 - BPS PFAR Report Fiscal Year 12.17.2021
P. 8
FINANCIAL SUMMARY
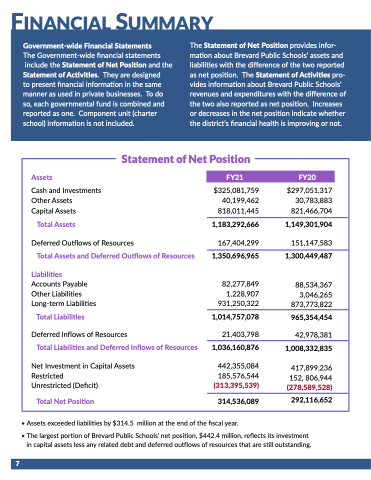
Statement of Net Position
FY21
$325,081,759 40,199,462 818,011,445
1,183,292,666
167,404,299
1,350,696,965
82,277,849 1,228,907 931,250,322
1,014,757,078
21,403,798
1,036,160,876
442,355,084
185,576,544
(313,395,539)
314,536,089
Assets
Cash and Investments Other Assets
Capital Assets
Total Assets
Deferred Outflows of Resources
Total Assets and Deferred Outflows of Resources
Liabilities
Accounts Payable Other Liabilities Long-term Liabilities
Total Liabilities
Deferred Inflows of Resources
Total Liabilities and Deferred Inflows of Resources
Net Investment in Capital Assets Restricted
Unrestricted (Deficit)
Total Net Position
FY20
$297,051,317 30,783,883 821,466,704
1,149,301,904
151,147,583
1,300,449,487
88,534,367 3,046,265 873,773,822
965,354,454
42,978,381
1,008,332,835
417,899,236 152, 806,944 (278,589,528)
292,116,652
• Assets exceeded liabilities by $314.5 million at the end of the fiscal year.
• The largest portion of Brevard Public Schools’ net position, $442.4 million, reflects its investment in capital assets less any related debt and deferred outflows of resources that are still outstanding.
Government-wide Financial Statements
The Government-wide financial statements include the Statement of Net Position and the
Statement of Activities. They are designed to present financial information in the same manner as used in private businesses. To do so, each governmental fund is combined and reported as one. Component unit (charter school) information is not included.
The Statement of Net Position provides infor- mation about Brevard Public Schools’ assets and liabilities with the difference of the two reported as net position. The Statement of Activities pro- vides information about Brevard Public Schools’ revenues and expenditures with the difference of the two also reported as net position. Increases or decreases in the net position indicate whether the district’s financial health is improving or not.
7
