
Page 15 - BPS PFAR Report Fiscal Year 2021
P. 15
r r %
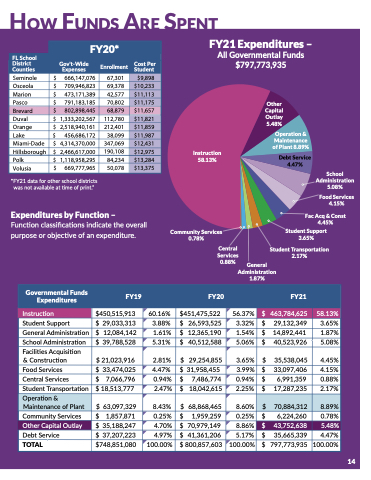
How Funds Are Spent
Brevard $ Duval $ Orange $ Lake $
$
802,898,445 1,333,202,567 2,518,940,161
456,686,172 4314370000
68,87 112,78 212,40
38,09 347,06 90,10 84,23 50,07
Miami-Dade
,,, Hillsborough $ 2,466,617,000 1
FY21 Expenditures –
Polk $ 1,118,958,295
669,777,965
Volusia $
Seminole
Osceola
Marion
Pasco
Duval
Lake
Land
Brevard
Construc
Improve
Orange
Furniture
Miami-Dade
HillsMbortourgVhe
PolkAV Mater
Volusia
$ 666,147,076
$ 709,946,823
$ 473,171,389
$ 791,183,185
$ 802,898,445
tion in Progress
$ 1,333,202,567
ents Other Than
$ 2,518,940,161
$ 456,686,172
, Fixtures, and Eq
$ 4,314,370,000
hi$cle2s,466,617,000
ia$ls 1a,n11d8C,9o5m8,2p9u5te
$ 669,777,965
TOTAL
FY20*
FL School
District Gov't-Wide Enrollment Cost Per Counties Expenses Student
67,301
69,378
42,577
70,802
68,879
112,780
Buildings
212,401
38,099
uipment
347,069
190,108
r S8o4ft,2w34ard
50,078
$9,898
$10,233
$11,113
$11,175
$11,657
$11,821
$11,859
$11,987
$12,431
$12,97$5
$13,28$4
$13,375
$
$
$
$
$
FY21 Capital Assets
m
Buildings and Fixed Equipment
*FY21 data for other school districts was not available at time of print.”
$
36,311,529 76,764,592 14,257,257
665,714,713
All Governmental Funds $797,773,935
Other Capital Outlay 5.48%
Operation & Maintenance of Plant 8.89%
Debt Service 4.47%
14,789,492
13,430,025
Instruction 58.13%
General Fund Expenditures by Object FY21
199,096
821,466,704
Due in One Year
Community Services 0.78%
Central Services 0.88%
School Administration 5.08%
Food Services 4.15%
Salaries $ 338,174,757 58.08% Employee Benefits $ 105,605,331 18.14%
Expenditures by Function –
Fac Acq & Const 4.45%
Student Support 3.65%
Student Transportation 2.17%
Purchased Services $ 97,655,841 16.77%
Function classifications indicate the overall
Other Energy Services $ 14,350,855 2.46% purpose or objective of an expenditure.
CapitalMaterials and Supplies Outlay
$ 13,437,966 2.31% $ 3,897,559 0.67% $ 9,167,098 1.57%
5.48% Capital Outlay Other
Operation & Maintenance of Plant 8.89%
TOTAL $ 582,289,407 100.00%
General Administration 1.87%
Debt Service
Governmental Funds
4.47%
FY19 FY20 FY21
Expenditures
School
Instruction Administra
tion
$450,515,913
60.16%
$451,475,522
56.37%
$ 463,784,625
58.13%
Student Support 5.08%
$ 29,033,313
3.88%
$ 26,593,525
3.32%
$ 29,132,349
3.65%
General Administration
Food Serv
415%
ices
$ 12,084,142
1.61%
$ 12,365,190
1.54%
$ 14,892,441
1.87%
School Administration
.
$ 39,788,528
5.31%
$ 40,512,588
5.06%
$ 40,523,926
5.08%
FacilitiesFAacqAucisqiti&oCnonst
& Construction
4.45%
$ 21,023,916
2.81%
$ 29,254,855
3.65%
$ 35,538,045
4.45%
Food Services
Student Support
$ 33,474,025
4.47%
$ 31,958,455
3.99%
$ 33,097,406
4.15%
3.65%
Central Services
$ 7,066,796
0.94%
$ 7,486,774
0.94%
$ 6,991,359
0.88%
deSntut dTreanntsTproarntsaptiorntation
$ 18,513,777
2.47%
$ 18,042,615
2.25%
$ 17,287,235
2.17%
2.17%
Operation & Maintenance of Plant
$ 63,097,329
8.43%
$ 68,868,465
8.60%
$ 70,884,312
8.89%
Community Services
$ 1,857,871
0.25%
$ 1,959,259
0.25%
$ 6,224,260
0.78%
Other Capital Outlay
$ 35,188,247
4.70%
$ 70,979,149
8.86%
$ 43,752,638
5.48%
Debt Service
$ 37,207,223
4.97%
$ 41,361,206
5.17%
$ 35,665,339
4.47%
TOTAL
$748,851,080
100.00%
$ 800,857,603
100.00%
$ 797,773,935
100.00%
Stu
al ation
14
