
Page 21 - BPS PFAR Report Fiscal Year 2021
P. 21
l 3
5 2 1 8 1
209
o e o
w k
t
s
s Comprehensive Annual Report for the year ended June 30 2020
, ,980 ,216
-
-
ecte 0/2
0,67
4,79
Long Term Debt (continued) ,058
d 1
4
Aa3 AA- AA-
Moody's S&P Fitch Highest Quality Aaa AAA AAA
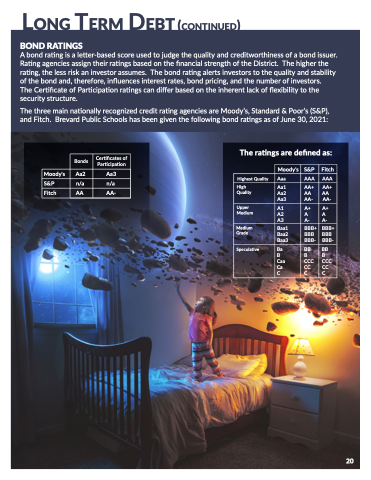
BOND RATINGS
High Aa1 AA+ AA+
A bond rating is a letter-based score used to judge the quality and creditworthiness of a bond issuer.
Quality
Aa2 AA AA
Rating agencies assign their ratings based on the financial strength of the District. The higher the
rating, the less risk an investor assumes. The bond rating alerts investors to the quality and stability
Upper A1 Medium
A+ A+ ofthebondandA,2thereforAe,inflAuencesinterestrates,bondpricing,andthenumberofinvestors.
Medium Baa1 BBB+ BBB+ 5 security structure.
4
The three main nationally recognized credit rating agencies are Moody’s, Standard & Poor’s (S&P),
Grade
Baa2 BBB BBB Baa3 BBB- BBB-
21 Long Term Debt
Balance 06/30/21 Due in One Year
17,684,429 45,215,955 16,946,793 70,699,579 31,250,322
8 Speculative Ba BB
BB
A3 A- A-
The Certificate of Participation ratings can differ based on the inherent lack of flexibility to the
and Fitch. Brevard Public Schools has been given the following bond ratings as of June 30, 2021:
tificates of Participation $
matedClaims C C$C
$ $ $ $ $ $ $
24,373,653 341,209 8,436,980 4,111,216 - - 37,263,058
Uncollected at 06/30/21
$ 9,760,674
$ 9,174,795 $ 8,286,274 $ 7,920,958 $ 8,045,487
$ 7,895,159 $ 7,412,957 $ 7,081,765 $ 7,228,226 $ 7,501,889
BBB
379,661,136 ds $ 1,042,430
7 Caa CCCCCC 9 CaCCCC
7
mpensated Absences
$
Percent Collected
96.64%
96.69% 96.89% 96.89% 96.75%
96.73% 96.77% 96.76% 96.75% 96.67%
The ratings are defined as:
Highest Quality
High Quality
Upper Medium
Medium Grade
Speculative
Moody's
Aaa
Aa1 Aa2 Aa3
A1 A2 A3
Baa1 Baa2 Baa3
Ba B Caa Ca C
S&P
AAA
AA+ AA AA-
A+ A A-
BBB+ BBB BBB-
BB B CCC CC C
Fitch
AAA
AA+ AA AA-
A+ A A-
BBB+ BBB BBB-
BB B CCC CC C
Bonds
Certificates of Participation
5
er Postemployment B
6
t Pension Liability
9
A
$ 280,519,297
$ 268,104,518 $ 258,233,553 $ 246,937,354 $ 239,597,480
$ 233,238,254 $ 221,801,019 $ 211,330,700 $ 215,064,612 $ 218,109,364
Moody's
S&P
Total Tax Levy
90,279,971
77,279,313 66,519,827 54,858,312 47,642,967
41,133,413 29,213,976 18,412,465 22,292,838 25,611,253
ar 2020
Company
ort Authority Project Ltd
Real & Estate, LLC , LLC
Inc.
Taxable Assessed Value
$ 48,852,233,473
$ 45,560,189,476 $ 42,311,450,495 $ 38,803,031,716 $ 35,807,253,742
$ 33,145,486,378 $ 31,232,317,152 $ 28,715,811,876 $ 27,457,119,378 $ 27,812,038,128
Fitch
ear 2020 - all taxpayers
$48,852,233,473
20
Total Collected
enefits
Bonds
Aa2
TOT
n/a
AA
Taxable Value (a)
$ 23,798,689 $ 3,880,300 $ 3,179,999 $ 2,682,802 $ 1,918,702 $ 1,867,789 $ 1,844,076 $ 1,375,231 $ 1,334,882 $ 1,276,664 $ 43,159,134
% of Total Asessed Value*
0.0487% 0.0079% 0.0065% 0.0055% 0.0039% 0.0038% 0.0039% 0.0028% 0.0027% 0.0026% 0.0883%
Certificates of
$
Participation
$4
Aa3
L$9
n/a
AA-
Moody's Aa2 Aa3 S&P n/a n/a Fitch AA AA-
6,27
FY
0,95
Cer
5,48
Bon
,15
Esti
,95
Co
,76
Oth
,22
Ne
,88
$2
$2 $2 $2 $2
$2 $2 $2 $2 $2
x ye
ight gies Airp
wer
cians orks
ets,
TAL
axy
ed value less exemptions.
