


Page 24 - Sites_August 16
P. 24
MIBOR REPORT
Halfway through the Year - Performance as Predicted
Halfway through 2016, residential real estate markets are performing as predicted at the beginning of the year. Sales and prices have been going up in most areas, while the number of homes for sale and total months’ supply of inventory have been going down. Meanwhile, many sellers have been getting a higher percentage of their asking price, and supply continues to struggle to meet demand. The message may be repetitive, but
it is largely positive.
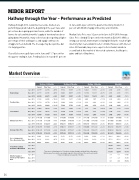
Closed Sales were up 5.4 percent in June and 11. 7 percent for the quarter ending in June. Pending Sales increased 8.1 percent
in June and 6.4 percent for the quarter. Inventory shrank 13.3 percent with Months Supply of Inventory at 4.0 months.
Median Sales Price rose 3.2 percent in June to $163,000. Average Sales Price climbed 5.0 percent for the month to $203,913. While a strong year overall, momentum is slowing bit likely the result of tight inventory that creates doubt in seller’s minds. However, with interest rates still favorable, buyers are eager. Sellers should consider a second look at this market of interested customers, healthy price gains and fast selling times.
24
Market Overview
Key market metrics for the current month and year-to-date figures.
Apr 2016 Pending Sales May 2016 Jun 2016
Rolling 12 Months
Current Prior Year + / –
31,592 28,508 31,769 28,770 32,009 28,992
+ 10.8% + 10.4% + 10.4%
Rolling 6 Months
Current Prior Year + / –
14,935 13,211 16,048 14,424 17,294 15,743
+ 13.0% + 11.3% + 9.9%
Rolling 3 Months
Current Prior Year + / –
12,043 11,566 13,350 13,261 13,603 13,914
+ 4.1% + 0.7% - 2.2%
Monthly
Current Prior Year + / –
Apr 2016 New Listings May 2016 Jun 2016
43,199 42,794 43,111 42,745 43,066 42,911
+ 0.9% + 0.9% + 0.4%
19,164 18,659 21,023 20,877 23,651 23,551
+ 2.7% + 0.7% + 0.4%
4,547 4,725 4,453 4,541 4,603 4,648
- 3.8% - 1.9% - 1.0%
8,802 7,891 9,623 8,836 9,690 9,106
+ 11.5% + 8.9% + 6.4%
3,235 3,068 3,266 3,089 3,189 2,949
+ 5.4% + 5.7% + 8.1%
Apr 2016 Closed Sales May 2016 Jun 2016
33,058 30,644 33,646 30,772 33,847 31,324
+ 7.9% + 9.3% + 8.1%
14,257 13,043 15,850 14,120 17,094 15,437
+ 9.3% + 12.3% + 10.7%
7,716 6,979 9,482 8,331 10,720 9,593
+ 10.6% + 13.8% + 11.7%
3,072 2,734 3,750 3,162 3,898 3,697
+ 12.4% + 18.6% + 5.4%
Apr 2016 Median Sales Price May 2016 Jun 2016
Apr 2016 Average Sales Price May 2016 Jun 2016
Pct. of Original List Price Received at Sale
Apr 2016 May 2016 Jun 2016
$148,500 $149,350 $150,000
$141,000 $142,500 $144,000
+ 5.3% + 4.8% + 4.2%
$184,659 $185,147 $186,320
$178,033 $179,145 $180,005
+ 3.7% + 3.4% + 3.5%
$145,000 $148,000 $152,000
$138,000 $140,500 $146,000
+ 5.1% + 5.3% + 4.1%
$180,313 $182,305 $187,066
$174,931 $177,357 $181,702
+ 3.1% + 2.8% + 3.0%
$146,500 $153,000 $158,000
$140,500 $148,500 $153,000
+ 4.3% + 3.0% + 3.3%
$180,050 $186,369 $193,824
$176,232 $182,371 $188,566
+ 2.2% + 2.2% + 2.8%
94.0% 93.0% 94.9% 93.9% 95.6% 94.5%
+ 1.1% + 1.1% + 1.2%
$150,000 $159,000 $163,000
$148,000 $153,000 $158,000
+ 1.4% + 3.9% + 3.2%
$184,732 $190,769 $203,913
$182,931 $186,765 $194,259
+ 1.0% + 2.1% + 5.0%
94.0% 93.4%
94.1% 93.4%
94.2% 93.5%
+ 0.6% + 0.7% + 0.7%
93.5% 92.7% 94.1% 93.1% 94.7% 93.7%
+ 0.9% + 1.1% + 1.1%
94.8% 94.0% 95.7% 94.5% 96.0% 94.9%
+ 0.9% + 1.3% + 1.2%
Apr 2016 Available at Month End May 2016 Jun 2016
Total Active Listings
There are no rolling figures for Total Active Listings Available at Month End or Absorption Rate because these metrics are simply snapshots frozen in time at the end of each month. It does not add up over a period of months.
10,809 12,057 10,944 12,353 11,150 12,857
- 10.4% - 11.4% - 13.3%
Months Supply of
Inventory / Absorption May 2016
Rate
Jun 2016
Apr 2016
3.9 4.7 3.9 4.8 4.0 4.9
- 17.0% - 18.8% - 18.4%
Data obtained from the Broker Listing Cooperative® (BLC®). Report format © 2016 ShowingTime. | 2


