
Page 38 - Bagi Sites_November17
P. 38
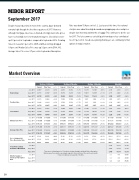
MIBOR REPORT
September 2017
Despiteheavyreductionsinmostofthecountry,buyerdemand remains high through the  rst three quarters of 2017. However, although mortgage rates have remained enticingly low, home prices have reached high levels for many home buyers. Closed Sales were up 0.9 percent in September compared to September 2016. Pending Sales increased 4.1 percent to 2,805, and New Listings dropped
0.9 percent. Median Sales Price was up 3.2 percent to $164,992. Average Sales Price rose 0.7 percent in September. Absorption
Ratewasdown15.8percentto3.2. Lastyearatthistime,thenational storyline was about how high demand was propping up sales and prices despite low inventory and months of supply. This continues to be the case for 2017. The late summer, early fall push from buyers has contributed to a 0.9 percent in closed sales proving that buyers are continuing to  nd options in today’s market.
38
Market Overview
Key market metrics for the current month as well as for rolling segments in which the given value represents 3, 6 or 12 months of activity.
Jul 2017 Pending Sales Aug 2017 Sep 2017
Rolling 12 Months
Current Prior Year + / –
33,531 32,068 33,606 32,464 33,716 32,467
+ 4.6% + 3.5% + 3.8%
Rolling 6 Months
Current Prior Year + / –
19,203 18,108 19,789 18,724 19,311 18,297
+ 6.0% + 5.7% + 5.5%
Rolling 3 Months
Current Prior Year + / –
13,293 13,309 13,031 12,888 11,900 11,902
- 0.1% + 1.1% - 0.0%
Monthly
Current Prior Year + / –
Jul 2017 New Listings Aug 2017 Sep 2017
43,017 43,213 43,156 43,307 43,125 43,512
- 0.5% - 0.3% - 0.9%
24,923 25,352 25,974 26,238 25,248 25,505
- 1.7% - 1.0% - 1.0%
4,143 4,253 4,171 4,032 3,586 3,617
- 2.6% + 3.4% - 0.9%
9,987 9,306 9,661 9,101 8,955 8,607
+ 7.3% + 6.2% + 4.0%
3,014 2,851 3,136 3,061 2,805 2,695
+ 5.7% + 2.5% + 4.1%
Jul 2017 Closed Sales Aug 2017 Sep 2017
36,261 33,861 36,388 34,249 36,418 34,658
+ 7.1% + 6.2% + 5.1%
19,609 18,857 21,144 20,265 21,164 20,801
+ 4.0% + 4.3% + 1.7%
11,302 11,141 11,148 10,783 10,206 10,081
+ 1.4% + 3.4% + 1.2%
3,461 3,493 3,519 3,392 3,226 3,196
- 0.9% + 3.7% + 0.9%
Jul 2017 Median Sales Price Aug 2017 Sep 2017
Jul 2017 Average Sales Price Aug 2017 Sep 2017
Pct. of Original List Price Received at Sale
Jul 2017 Aug 2017 Sep 2017
$160,000 $160,000 $161,000
$150,000 $150,000 $151,500
+ 6.7% + 6.7% + 6.3%
$196,808 $198,049 $198,163
$186,155 $186,536 $187,987
+ 5.7% + 6.2% + 5.4%
$165,000 $165,000 $167,000
$154,900 $156,000 $157,900
+ 6.5% + 5.8% + 5.8%
$201,161 $203,059 $204,529
$189,685 $192,000 $194,148
+ 6.1% + 5.8% + 5.3%
$170,000 $169,500 $165,500
$160,000 $159,500 $157,500
+ 6.3% + 6.3% + 5.1%
$208,553 $209,306 $204,573
$196,329 $196,947 $194,492
+ 6.2% + 6.3% + 5.2%
96.5% 95.8% 96.3% 95.7% 95.9% 95.4%
+ 0.7% + 0.6% + 0.5%
$169,500 $164,275 $164,992
$158,900 $154,900 $159,900
+ 6.7% + 6.1% + 3.2%
$209,227 $205,108 $198,986
$193,845 $192,140 $197,696
+ 7.9% + 6.7% + 0.7%
95.2% 94.4%
95.3% 94.5%
95.3% 94.6%
+ 0.8% + 0.8% + 0.7%
95.8% 95.1%
96.0% 95.3%
96.1% 95.5%
+ 0.7% + 0.7% + 0.6%
96.3% 95.7% 95.9% 95.4% 95.4% 95.0%
+ 0.6% + 0.5% + 0.4%
Jul 2017 Available at Month End Aug 2017 Sep 2017
Total Active Listings
There are no rolling figures for Total Active Listings Available at Month End or Absorption Rate because these metrics are simply snapshots frozen in time at the end of each month. It does not add up over a period of months.
9,625 11,377 9,826 11,334 9,589 11,013
- 15.4% - 13.3% - 12.9%
Months Supply of
Inventory / Absorption Aug 2017
Rate
Sep 2017
Jul 2017
3.2 4.0 3.2 4.0 3.2 3.8
- 20.0% - 20.0% - 15.8%
Data obtained from the Broker Listing Cooperative® (BLC®). Report format © 2017 ShowingTime. | 2
